Raspberry Pi as a Google Calendar Alarm Clock

This post isn’t really thumbnail conducive but I tried!

I have been sleeping in too much. I would like an alarm clock that is easy to set and will play a random song to wake me up.

For a while I was using this program, but as you may be able to tell it requires an awful lot of user input, which isn’t ideal for a sleepy person as they may mess up (as I have, thus this post) but the “fire()” command works really well. To use this program you will need AP scheduler and MPG321 (sudo apt-get install mpg321)

But it wasn’t working. I wanted a way to re-purpose a service I use everyday (that way I wouldn’t have to modify my workflow) as an Alarm Clock. I landed on Google Calendar because I can add events from pretty much every device I interact with on a daily basis, and upon searching found out that developing using the python API wasn’t that hard at all.

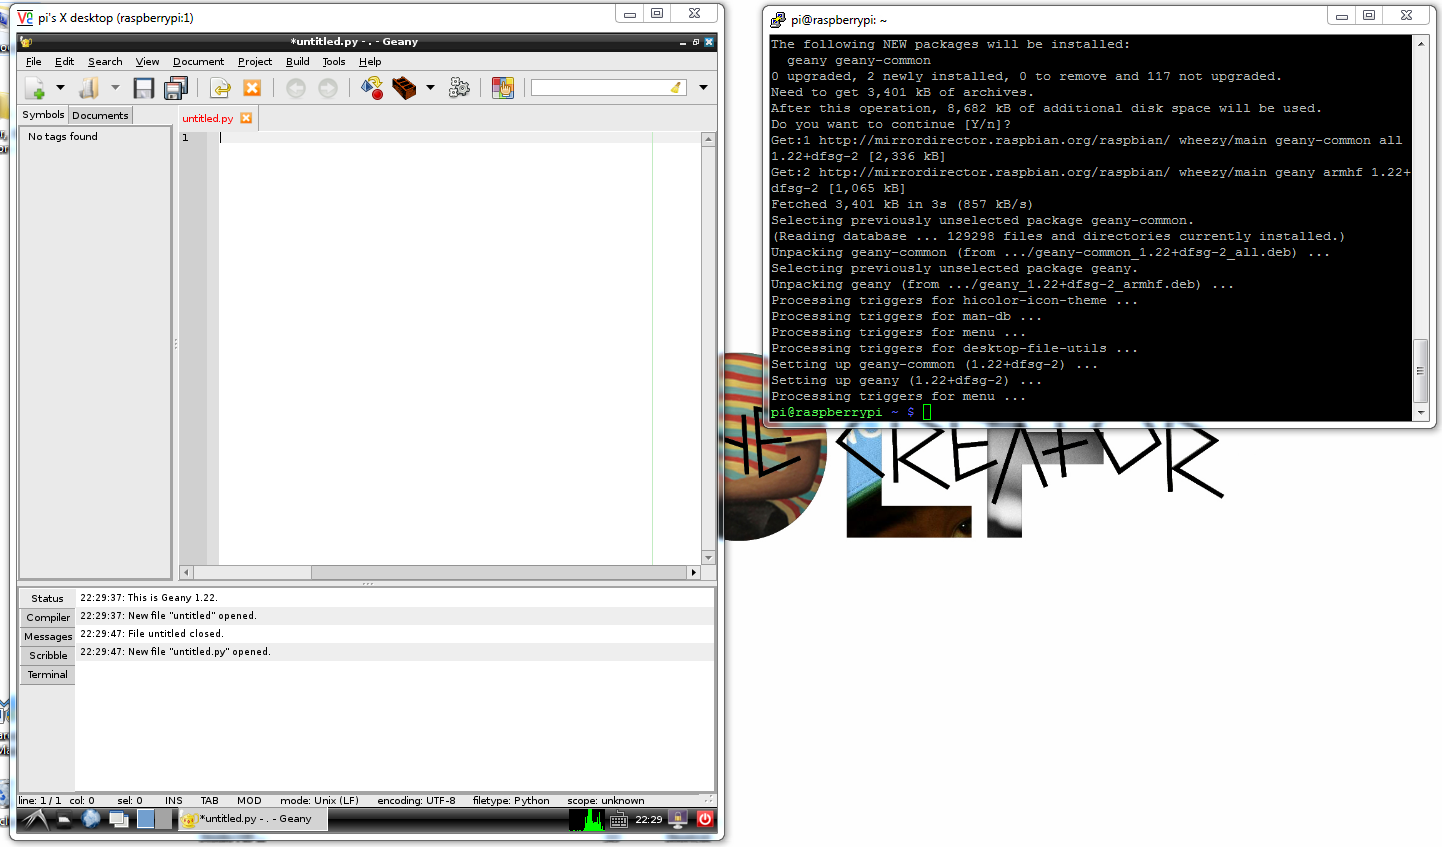
To kick things off, you’ll need to download and install the Google Data Library.

I’ll be using this version. Unzip the .tar.gz and from the top top level directory it creates, install the setup.py file. Then run the tests/run_data_tests.py to see if it all works. Mine does fine but it if yours doesn’t, go through this guide written by google to get yourself up and running.

The brunt of this program comes down to a single boolean statement, but first we have to set that up. The API produces an rfc3339 time, and that’s a lot of irrelevant information for this application.

To convert the time I’m using something I found on stackoverflow.

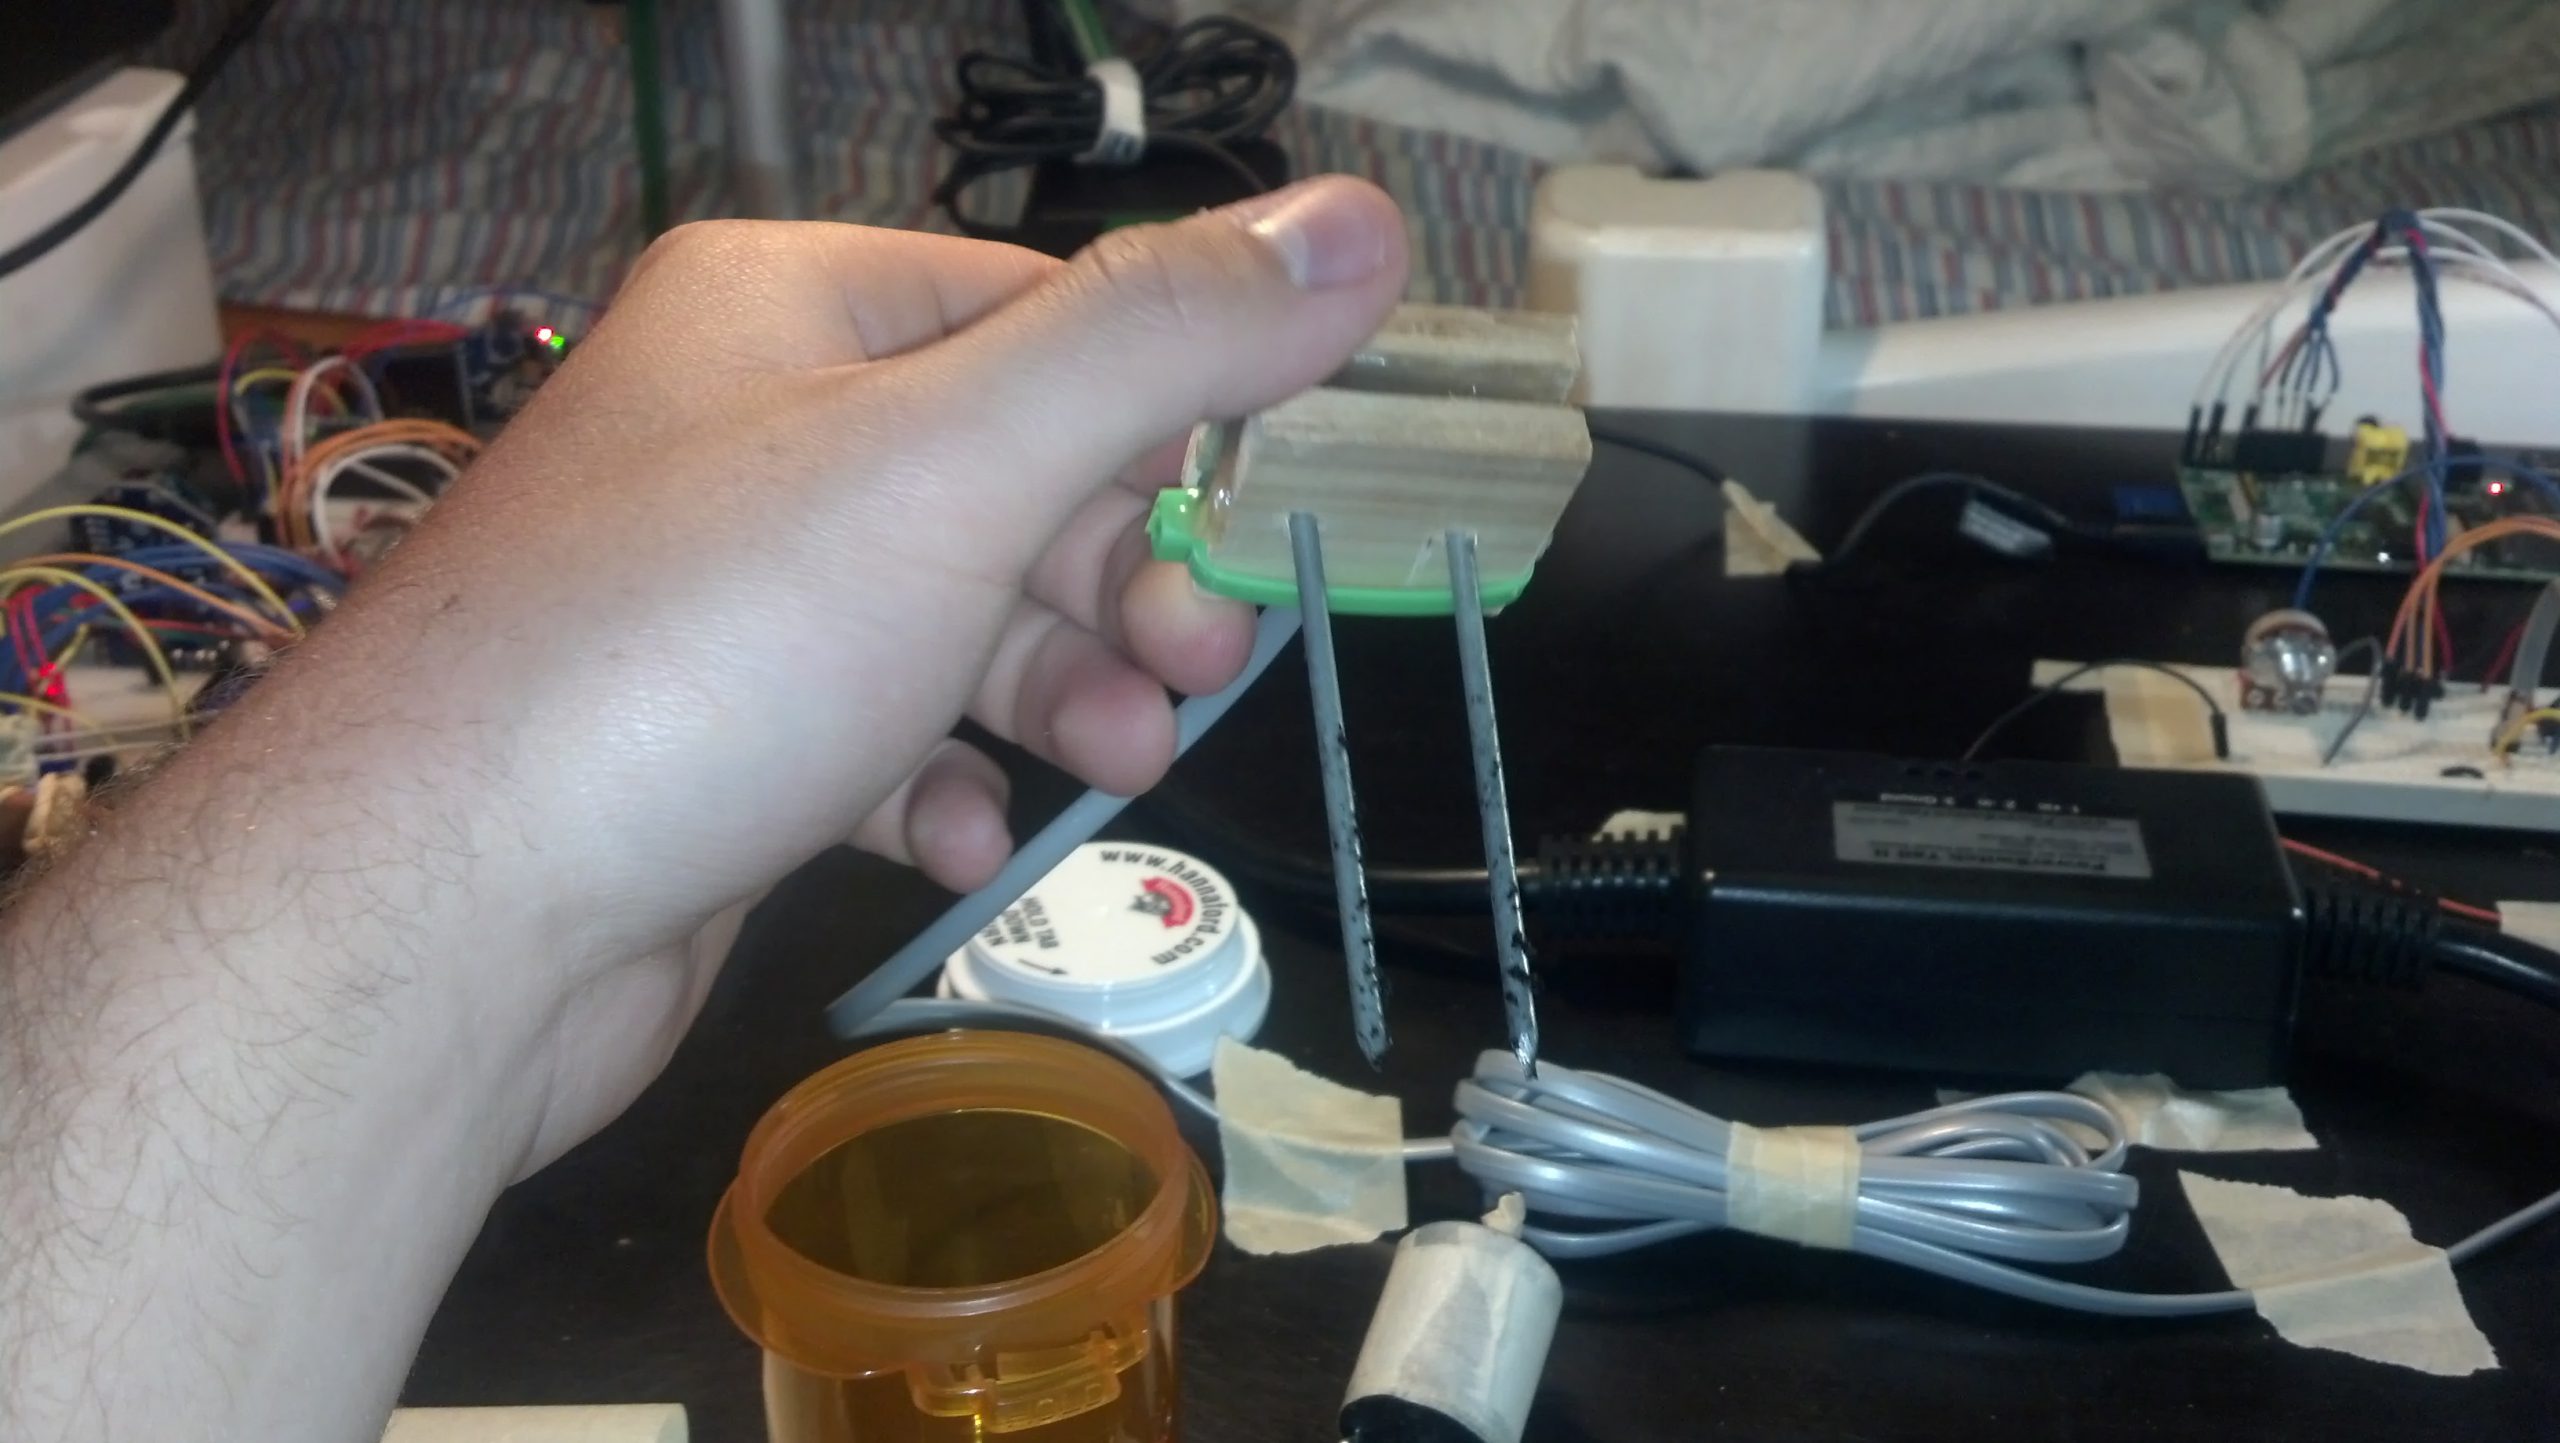
Here’s a video of the system in action, and a basic overview of the setup:

Here’s my program:

And there you have it! thanks for reading and leave me a comment if you have any questions/suggestions.

Hey! This post was written a long time ago, but I'm leaving it up on the off-chance it may help someone. Proceed with caution. It may not be a good idea to blindly integrate this code or work into your project, but instead use it as a starting point.

PiPlanter | Second round of data collection

So as I said in one of my previous posts, I am going to be collecting a lot of data over the next few weeks while the tomato plants grow. I will be doing this to determine when soil is “dry” and how temperature and light effect that process. For the last week I have been collecting data in the configuration seen in my last post and here is the graph it produced you can click to see the full image:

This graph proves a few things. The first thing is that the relative moisture sensor works. As one can intuitively understand, if you don’t add more water into the system, nature will remove water via evaporation. The overall trend of the blue line (the rel mst sensor) is downward, backing up this point.

The problem with this setup was that I was spitting the voltage across the two probes constantly, which along with the water caused the nails to rapidly oxidize, which is something I would like to avoid in the long term. This also may have seriously corrupted the data so besides general trends, this whole set is unusable.

This isn’t necessarily a bad thing though, as I wanted to conduct a second trial with more probes and more dirt.

I decided to go with 4 probes, and here are a few pictures of the assembly process. Assembly process is the same, I just did it at my school:

I cut it into 3cm sections and then drilled holes on the midpoints of the 2nd and 3rd cm as seen in a photo below.

Here are the holes drilled for the nails

Here are the nails inserted into all 4

Here is the wire wrapped around the nail

Once solder is applied, the connection is very strong and conductive

Here’s the gluing process

Here are all of the sensors assembled. I attached headers to the other ends as seen in the last post.

Since i’m using 4 sensors now, and to get around the oxidation problem, I added a NPN transistor to cut the ground current when the sensor isn’t being used so it only turns on when it’s getting polled. Here is the new python code:

It’s pretty much the same thing.

The graph is also very similar, but I won’t post that code as it’s not different enough.

Here are pictures of setting up the whole system:

I used the same soil as seen in the previous post, and added 125mL of water to each sample.

Here’s a video of me explaining the whole process:

Once enough data is collected I’ll post a graph of it here.

Hey! This post was written a long time ago, but I'm leaving it up on the off-chance it may help someone. Proceed with caution. It may not be a good idea to blindly integrate this code or work into your project, but instead use it as a starting point.

PiPlanter | Planting Seeds!

This is a short post illustrating the process of planting the seeds.


Hey! This post was written a long time ago, but I'm leaving it up on the off-chance it may help someone. Proceed with caution. It may not be a good idea to blindly integrate this code or work into your project, but instead use it as a starting point.

PiPlanter | Moisture detector and a few other updates

Long time viewers will remember when this idea was conceived two Novembers ago, but essentially it’s a way to detect the relative moisture of a substance.

The principal is the same as in the above post, but this time, I made it bigger and attached it to a Raspberry Pi. The reason this is essential, is because I recently purchased a 12v DC pump capable of moving water. I will be able to sense the relative moisture in the plant, and then the plant will be able to water “itself”.

That will be done in python with the same basic technique I’ve been using all along, but in addition to gathering data about the plant every hour or so, it will be able to see if the plant needs water (by checking hopefully an array of moisture sensors) and then turning on the pump and watering it. I will also eventually integrate twitter and a webcam, but those cosmetic editions come once I know the system works.

To test it, I’ve added another set of data to the graph as seen in the last post and created a testing environment in my windowsill.

Basically I’ve put some dirt and 100mL of water into a container and inserted the sensor and am monitoring the moisture level over the next n hours, here are some pictures:

And here is a graph of some of the data:

I will make another post later today illustrating the process of plating the seeds.

Hey! This post was written a long time ago, but I'm leaving it up on the off-chance it may help someone. Proceed with caution. It may not be a good idea to blindly integrate this code or work into your project, but instead use it as a starting point.

PiPlanter | Graphing timed mysql data with pchart

Time to get this data we’re harvesting graphed. In a couple past posts, I’ve used pChart to graph random data but now since data is getting dumped into a mysql chart, it would make sense to try and graph that data.

To install pChart on my system (same installs as listed in this post) to do that do the following:

First, get the php5-gd package by running:

Then download, rename and move the pChart files to the proper directory:

Now pChart is ready to be used.

I used a lot of the info found here:

http://wiki.pchart.net/doc.mysql.integration.html

http://wiki.pchart.net/doc.doc.draw.scale.html

The code is pretty well commented so I’m not really going to get into describing it, but essentially, the following php will retrieve data from a mysql table (which is being populated by a python script seen in this post) and after leaving it on in my room for like 3 days, render this graph:

Here’s that php script:

Hey! This post was written a long time ago, but I'm leaving it up on the off-chance it may help someone. Proceed with caution. It may not be a good idea to blindly integrate this code or work into your project, but instead use it as a starting point.

PiPlanter | Basic package setup and bringing everything together

I’m in a hotel trying to occupy myself with something interesting so I’ve decided to work on this. I had to re-image the SD card I’ve been developing this project on, but I saved to code so there’s no problem there. Now I need to re-install all the basic packages.

First I need to get the components of a LAMP server with the following commands:

Once you get the mysql server setup, you’ll need to create a database and tables in mysql.

To create the database you’ll be using run the following command:

And then grant the proper privileges to use later with the command:

Then we can enter the database and create a table:

Now we need to set up the specific libraries for python the first of which being spidev, the spi tool for the raspberry pi which we can grab from git using the following commands:

You also need to (copied from http://scruss.com/blog/2013/01/19/the-quite-rubbish-clock/):

As root, edit the kernel module blacklist file:

Comment out the spi-bcm2708 line so it looks like this:

Save the file so that the module will load on future reboots. To enable the module now, enter:

We will also need WiringPi:

Then you need to get APscheduler, the timing program used to execute the incremental timing with the following commands:

You will need mysqldb to interface python and mysql:

Once you reboot, the following program should work:

And there you go! The program should log data every minute and then every hour to two different tables. To view those data sets as php tables you can use this php script:

Sometime later I’ll get to graphing the data.

Hey! This post was written a long time ago, but I'm leaving it up on the off-chance it may help someone. Proceed with caution. It may not be a good idea to blindly integrate this code or work into your project, but instead use it as a starting point.

PiPlanter | Using APScheduler to get timed samples in python

I’m taking a “break” from my drone while I save some money to buy more tricopter parts, and since the weather’s getting nicer and nicer I’ve decided to start working on my PiPlanter again.

As a refresher, the PiPlanter is a Raspberry Pi powered garden. The goal is for it to just be able to be plugged in and add water to a water source and have the Pi monitor temp and moisture levels to be able to add more water as needed.

I’ve shown that is relatively easy to go from analog sensors to good looking tables and graphs using the raspberry pi, the problem that I ran into however was timing.

It became harder and harder to use the time.sleep function in python to handle long periods of time. When you are dealing with things like plants, you don’t need to water it very often, but for data’s sake, you should be polling the sensors a lot.

I’ve landed on the use of APScheduler in python, and here’s my source code:

[py]
#Timing setup
from datetime import datetime
from apscheduler.scheduler import Scheduler
import time

import logging #if you start getting logging errors, uncomment these two lines
logging.basicConfig()

#GPIO setup
import RPi.GPIO as GPIO
GPIO.setmode(GPIO.BOARD)

GPIO.cleanup()

pin = 26 #pin for the adc
GPIO.setup(pin, GPIO.OUT)
led1 = 11 #pin for the short indicator led
GPIO.setup(led1, GPIO.OUT)
led2 = 13 #pin for other long indicator led
GPIO.setup(led2, GPIO.OUT)

#the adc’s SPI setup
import spidev
spi = spidev.SpiDev()
spi.open(0, 0)

going = True

#fuction that can read the adc
def readadc(adcnum):
# read SPI data from MCP3008 chip, 8 possible adc’s (0 thru 7)
if adcnum > 7 or adcnum < 0:
return -1
r = spi.xfer2([1, 8 + adcnum << 4, 0])
adcout = ((r[1] & 3) << 8) + r[2]
return adcout

def rapidSample():
sampleTemp1 = (((readadc(0)*3.3)/1024)/(10.0/1000)) #this translates the analog voltage to temperature in def F
sampleLght1 = readadc(1)
samplePot1 = readadc(2)

GPIO.output(led1, True) #turns the led on
time.sleep(.1) #sleeps a little bit so you can see the LED on
print "Job 1", datetime.now(),"LDR:",sampleLght1 ,"Pot:",samplePot1,"Temp:",sampleTemp1 #prints the debug info
time.sleep(.1)
GPIO.output(led1, False) #turns the led off

def slowSample():
print "Job 2" , datetime.now()
GPIO.output(led2, True) #turns the led on
time.sleep(5)
GPIO.output(led2, False) #turns the led on

if __name__ == ‘__main__’:
#the following 3 lines start up the interval job and keep it going
scheduler = Scheduler(standalone=True)
scheduler.add_interval_job(rapidSample, seconds=1)
scheduler.add_interval_job(slowSample, minutes=1)
scheduler.start()
[/py]

This produces a loop that flashed a green led on and of for .1 seconds at a time per second, and then every minute, turns on a speaker and a red led for 5 seconds then turns it off. There are some images of what goes on below.

Here is a picture of the the print dialog in python:

You can see that the first job (green led) posts the values from the analog sensors every second

The second job (red led) just posts the time. But the function is expandable to do anything at any time.

Here are pictures of the board and the circuit in action:

Both LED’s off

The Green LED on, the red circled process in the printout

Here are both on

The next step is adding the mySQL in as seen in some other posts.

Hey! This post was written a long time ago, but I'm leaving it up on the off-chance it may help someone. Proceed with caution. It may not be a good idea to blindly integrate this code or work into your project, but instead use it as a starting point.

Plane | Adding an LCD to the controller, and using Visual Basic for feedback

So here’s a video:

So pretty easy but important step here. For a while I’ve known that I need to have some more feedback from the robot that just LED brightness levels on the controller. This VB program allows me to get analog values from the vehicle and interpret them in any number of ways. You can download and run that program HERE, and like I said in the video I’ve refrained from going open source with my VB programs in the past because they’ve never really had any polish to them. But now I think it will be good to keep this all open.

I also added a 16 * 2 character LCD to my controller. I’ve sacrificed the 6 pins because hopefully in the long run it will be a better experience for the user. I may go back, but for now I’d rather build around something that’s a little more constraining as it will force me to innovate a little bit more. Here’s a picture of the new controller:

Here’s the program:

I didn’t mention in in the video, but I moved the mux from the controller, to the vehicle. It allows me to have 22 analog inputs, and the reason I took so long to finally add it was primarily laziness on my part. Aside from the the code is still very similar but close followers will notice that I cleaned up the way the program receives and sends code. It is much much more organized, and much more expandable. Here’s the “new” controller:

Here’s the new program:

Like I promised in the video, here are a few more properly focused pictures:

Hey! This post was written a long time ago, but I'm leaving it up on the off-chance it may help someone. Proceed with caution. It may not be a good idea to blindly integrate this code or work into your project, but instead use it as a starting point.

Plane | List of things to do [Documentation]

So as school and sports start to ramp up, it’s going to get harder and harder to make time for this project as I want to complete it by the first week of summer.

I made some huge progress today, but it’s really still a baby step, the proof of concept using a brushless motor was reassuring that this will be expandable into something  that is powered by brushless motors (some kind of tricopter) but there’s still quite a lot to get done.


First things first, I’d like to get started on re-tooling “Vehicle_Companion” to fit the needs of this new communication protocol I’ve established. Before it acted as an intermediate between the Arduinos, and now it shouldn’t have any effect on that at all, and should only supply visual feedback from the controller.

Reason being is that I need to get more feedback from the drone than led brightness levels. Plus I’m getting a little tired of C, it’ll be good to get back into VB for a while.


I also need to come up with a way to power the controller. Plain and simple it doesn’t make sense that it’s still tied to a computer.


After that I need to start locking down the vehicle’s PCB. I don’t need to do this to the controller as it’s BOUND to go through countless revisions as the vehicle does. Since the RC car is going to be able to be operated basically with just the joystick, It wouldn’t make sense to over complicate things. Here’s a preview of what it may look like.


After that it’s time to make some decisions on what the final form of this thing is going to be, I go back and forth because of a few reasons but for now I that some sort of multirotor is going to be the best.

Hey! This post was written a long time ago, but I'm leaving it up on the off-chance it may help someone. Proceed with caution. It may not be a good idea to blindly integrate this code or work into your project, but instead use it as a starting point.

Plane | Ground based system all working! [Demonstration]

Pretty big day for me today. Here’s a video:

I’m pretty proud of this one, the only problem of this is that the l298N get’s too hot, you can see in the pictures that I’ve installed a makeshift heatsink but it still get’s really hot:

Motor Driver 1

I also installed the 5v@3a regulator I mentioned in the last post, here are some pictures:


Here’s the vehicle code:

Here’s the controller code:

I’m verrry proud of the progress thus far. As for next steps, I need to lock down the vehicle circuit into a soldered perf-board, and I need to come up with a better power solution for the controller. Thanks for reading!

Hey! This post was written a long time ago, but I'm leaving it up on the off-chance it may help someone. Proceed with caution. It may not be a good idea to blindly integrate this code or work into your project, but instead use it as a starting point.