Time to get this data we’re harvesting graphed. In a couple past posts, I’ve used pChart to graph random data but now since data is getting dumped into a mysql chart, it would make sense to try and graph that data.
To install pChart on my system (same installs as listed in this post) to do that do the following:
First, get the php5-gd package by running:
|
1 |
sudo apt-get install php5-gd |
Then download, rename and move the pChart files to the proper directory:
|
1 2 3 4 |
sudo mkdir /srv/www/lib/ sudo wget http://www.pchart.net/release/pChart2.1.3.tar.gz sudo tar -xzvf pChart2.1.3.tar.gz sudo mv pChart2.1.3 pChart |
Now pChart is ready to be used.
I used a lot of the info found here:
http://wiki.pchart.net/doc.mysql.integration.html
http://wiki.pchart.net/doc.doc.draw.scale.html
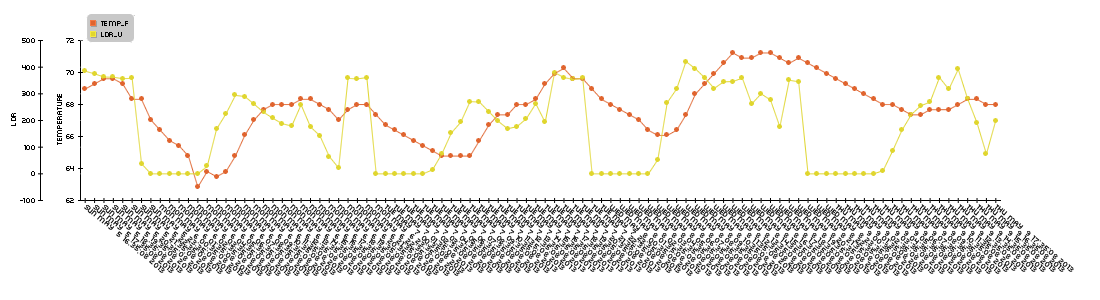
The code is pretty well commented so I’m not really going to get into describing it, but essentially, the following php will retrieve data from a mysql table (which is being populated by a python script seen in this post) and after leaving it on in my room for like 3 days, render this graph:
Here’s that php script:
|
1 2 3 4 5 6 7 8 9 10 11 12 13 14 15 16 17 18 19 20 21 22 23 24 25 26 27 28 29 30 31 32 33 34 35 36 37 38 39 40 41 42 43 44 45 46 47 48 49 50 51 52 53 54 55 56 57 58 59 60 61 62 63 |
<?php /* Include all the classes */ include("/srv/www/lib/pChart/class/pData.class.php"); include("/srv/www/lib/pChart/class/pDraw.class.php"); include("/srv/www/lib/pChart/class/pImage.class.php"); /* Create your dataset object */ $myData = new pData(); $db = mysql_connect("localhost", "piplanter_user", "piplanter_pass"); //location of server, db username, db pass mysql_select_db("piplanter", $db); $Requete = "SELECT * FROM `piplanter_table_05`"; //table name $Result = mysql_query($Requete, $db); /*This fetches the data from the mysql database, and adds it to pchart as points*/ while($row = mysql_fetch_array($Result)) { //$Sample_Number = $row["Sample_Number"]; //Not using this data //$myData->addPoints($Sample_Number,"Sample_Number"); $Time = $row["Time"]; $myData->addPoints($Time,"Time"); $Temp_F = $row["Temp_F"]; $myData->addPoints($Temp_F,"Temp_F"); $LDR_V = $row["LDR_V"]; $myData->addPoints($LDR_V,"LDR_V"); } $myData-> setSerieOnAxis("Temp_F", 0); //assigns the data to the frist axis $myData-> setAxisName(0, "Temperature"); //adds the label to the first axis $myData-> setSerieOnAxis("LDR_V", 1); $myData-> setAxisName(1, "LDR"); $myData-> setAxisPosition(1,AXIS_POSITION_LEFT); //moves the second axis to the far left $myData->setAbscissa("Time"); //sets the time data set as the x axis label $myPicture = new pImage(1100,300,$myData); /* Create a pChart object and associate your dataset */ $myPicture->setFontProperties(array("FontName"=>"/srv/www/lib/pChart/fonts/pf_arma_five.ttf","FontSize"=>6)); /* Choose a nice font */ $myPicture->setGraphArea(80,40,1000,200); /* Define the boundaries of the graph area */ $Settings = array("R"=>250, "G"=>250, "B"=>250, "Dash"=>1, "DashR"=>0, "DashG"=>0, "DashB"=>0); $myPicture->drawScale(array("LabelRotation"=>320)); /* Draw the scale, keep everything automatic */ /*The combination makes a cool looking graph*/ $myPicture->drawPlotChart(); $myPicture->drawLineChart(); $myPicture->drawLegend(90,20); //adds the legend $myPicture->autoOutput(); /* Build the PNG file and send it to the web browser */ ?> |