#Timing setup
from datetime import datetime
from apscheduler.scheduler import Scheduler
import time
import datetime
import sys
import os
now =datetime.datetime.now()
#import logging #if you start getting logging errors, uncomment these two lines
#logging.basicConfig()
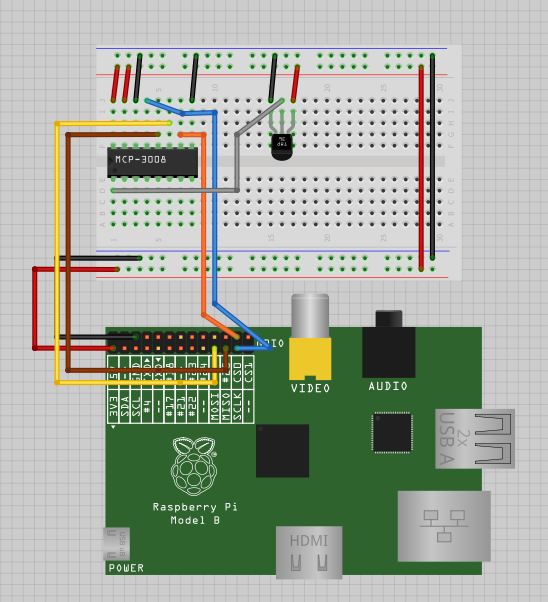
#GPIO setup
import RPi.GPIO as GPIO
GPIO.setmode(GPIO.BOARD)
GPIO.cleanup()
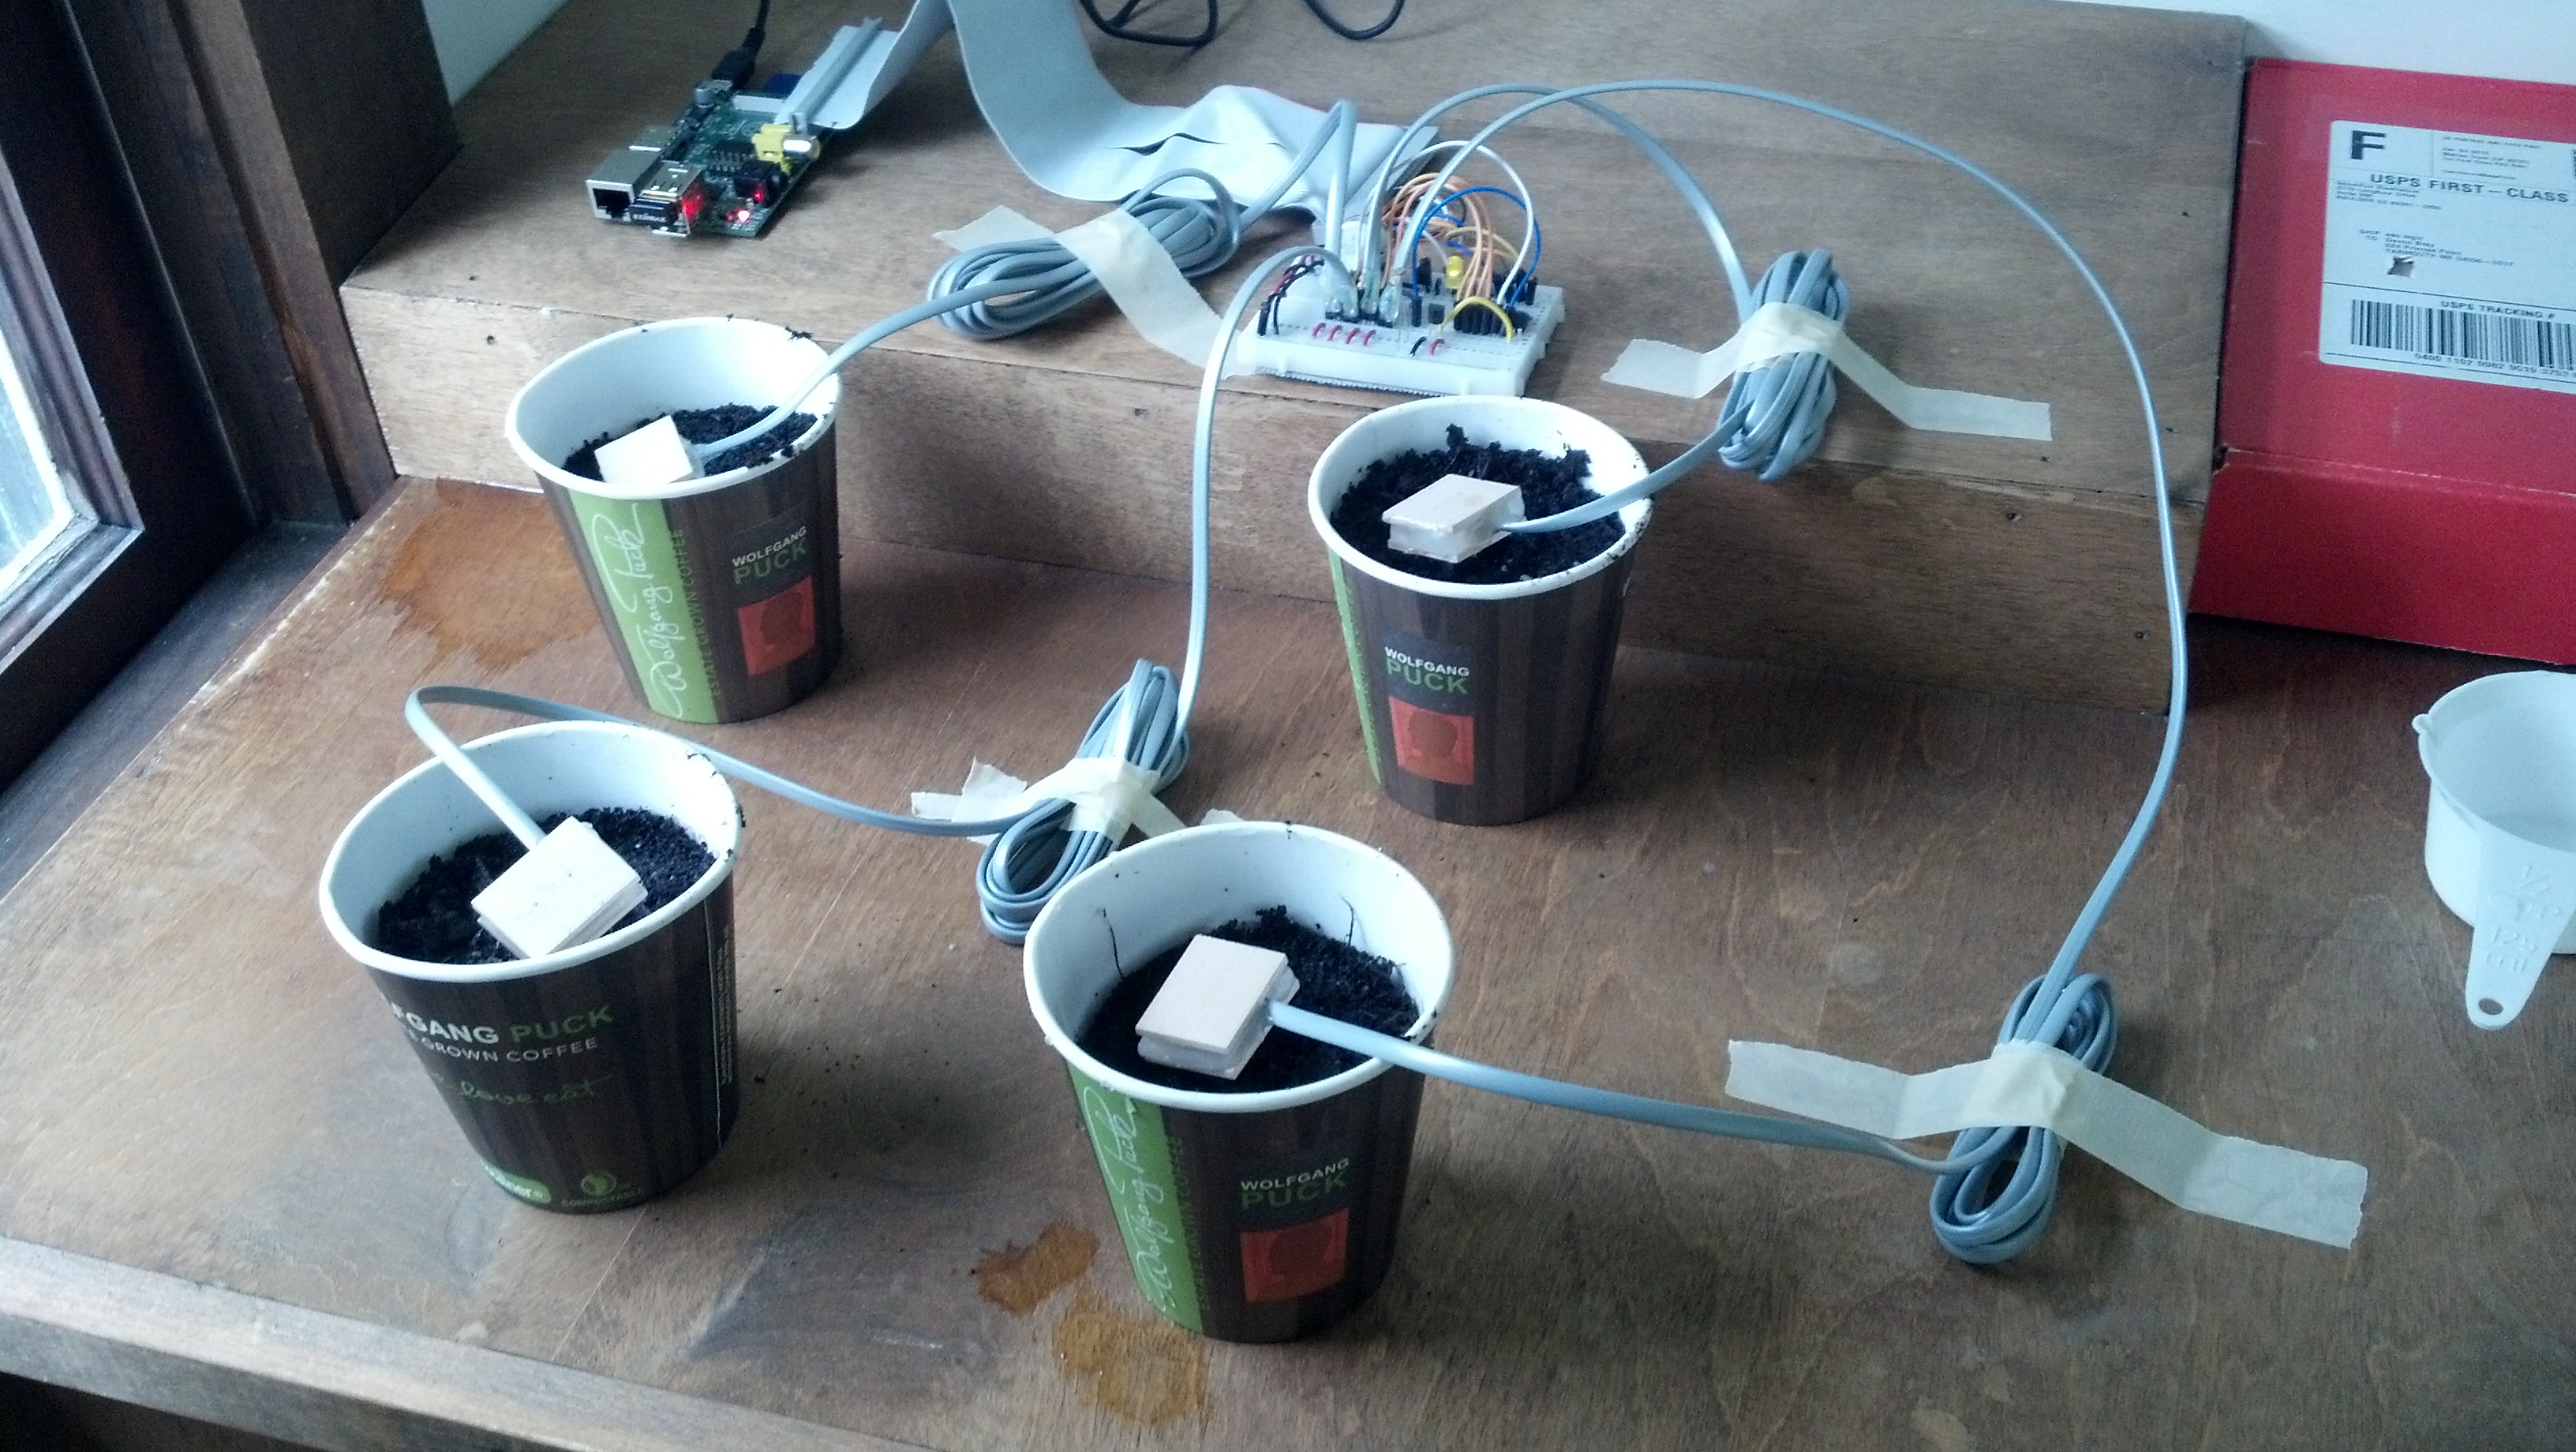
pin = 26 #pin for the adc
GPIO.setup(pin, GPIO.OUT)
NPNtrans = 3 #the pin for the npn transistor
GPIO.setup(NPNtrans, GPIO.OUT)
sampleLED = 5 #the indicator LED
GPIO.setup(sampleLED, GPIO.OUT)
pump = 7 #pin for the pump
GPIO.setup(pump, GPIO.OUT)
GPIO.output(pump, False)
#the adc's SPI setup
import spidev
spi = spidev.SpiDev()
spi.open(0, 0)
#sets up the program's ability to write to a mysql database
import MySQLdb
con = MySQLdb.connect('localhost','piplanter_user','piplanter_pass','piplanter');
cursor = con.cursor()
#tweepy setup, you must use the keys given to you when you create your app
import tweepy
consumer_key=""
consumer_secret=""
access_token=""
access_token_secret=""
#"logs in" to twitter,
auth = tweepy.OAuthHandler(consumer_key, consumer_secret)
auth.set_access_token(access_token, access_token_secret)
api = tweepy.API(auth)
#Flickr Setup
import flickrapi
api_key = ''
api_secret = ''
flickr = flickrapi.FlickrAPI(api_key, api_secret, format='json')
(token, frob) = flickr.get_token_part_one(perms='write')
if not token: raw_input("Press ENTER after you authorized this program")
flickr.get_token_part_two((token, frob))
#Variable Setup
ontime = 60
global table_number
table_number = 0
#fuction that can read the adc
def readadc(adcnum):
# read SPI data from MCP3008 chip, 8 possible adc's (0 thru 7)
if adcnum > 7 or adcnum < 0:
return -1
r = spi.xfer2([1, 8 + adcnum << 4, 0])
adcout = ((r[1] & 3) << 8) + r[2]
return adcout
def water():
print "===== Starting Watering Process ====="
GPIO.output(NPNtrans, True)
GPIO.output(sampleLED, True)
time.sleep(1)
sensor1_before = readadc(0)
sensor2_before = readadc(1)
sensor3_before = readadc(2)
sensor4_before = readadc(3)
before = "WATERING START / Moisture Before - " + "Sensor 1:" + str(sensor1_before) + " Sensor 2:" + str(sensor2_before) + " Sensor 3:" + str(sensor3_before) + " Sensor 4:" + str(sensor4_before) + " - Average:" + str((float(sensor1_before+sensor2_before+sensor3_before+sensor4_before)/4))
api.update_status(before)
print before
GPIO.output(pump, True)
time.sleep(ontime)
GPIO.output(pump, False)
time.sleep(60) #gives the water time to penetrate the soil
sensor1_after = readadc(0)
sensor2_after = readadc(1)
sensor3_after = readadc(2)
sensor4_after = readadc(3)
after = "WATERING COMPLETED / Moisture After - " + "Sensor 1:" + str(sensor1_after) + " Sensor 2:" + str(sensor2_after) + " Sensor 3:" + str(sensor3_after) + " Sensor 4:" + str(sensor4_after) + " - Average: " + str((float(sensor1_after+sensor2_after+sensor3_after+sensor4_after)/4))
api.update_status(after)
print after
GPIO.output(NPNtrans, False)
GPIO.output(sampleLED, False)
print "====== Watering Process Complete ====="
def hourlyUpdate():
GPIO.output(pump, False)
print "----------start----------\n"
GPIO.output(NPNtrans, True)
GPIO.output(sampleLED, True)
time.sleep(1)
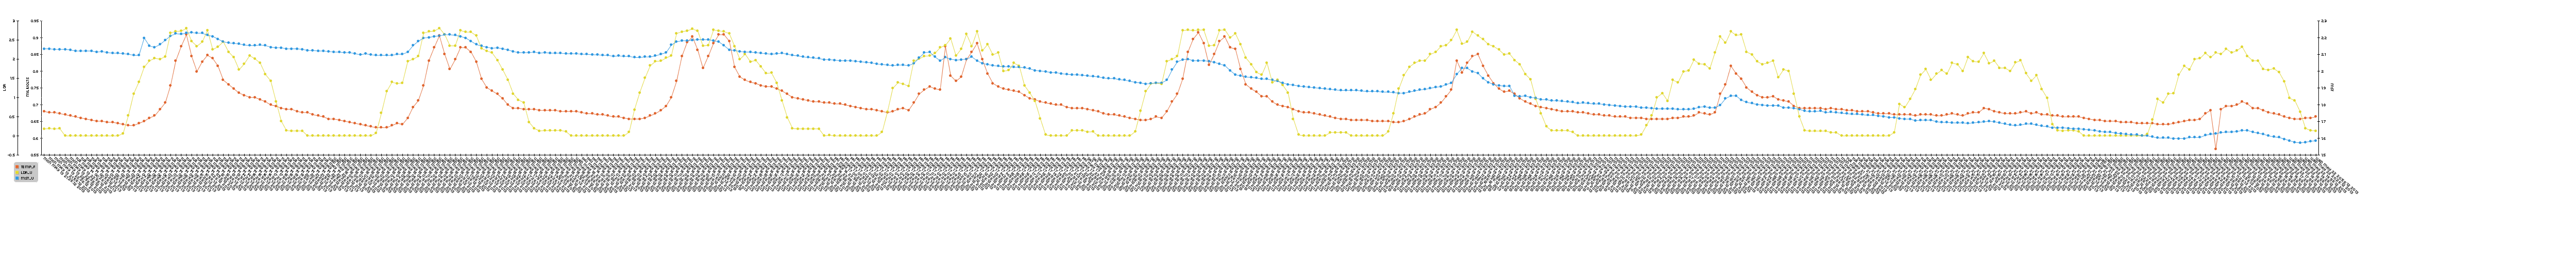
sampleTime = time.ctime()
mst1 = 1024-readadc(0)
mst2 = 1024-readadc(1)
mst3 = 1024-readadc(2)
mst4 = 1024-readadc(3)
pot1 = readadc(4)
ldr1 = readadc(5)
millivolts = readadc(6)*(3300.0/1024.0)
temp_c = ((millivolts - 100.0)/10)-40.0
tmp1 = (temp_c * 9.0 / 5.0) + 32
print 'Polling Probes \n'
#prints debug info to console
print sampleTime,"|","MST1:",mst1,"MST2:",mst2,"MST3:",mst3,"MST4:",mst4,"Pot1:",pot1,"LDR1:",ldr1,"TMP1:",tmp1 #prints the debug info
global table_number
print 'Adding Data To Table: ' + str(table_number)
#adds the data to the mysql table
global table_number
cursor.execute('INSERT INTO piplanter_table_'+ table_code +'(Time,mst1_V,mst2_V,mst3_V,mst4_V,pot1_V,ldr1_V,tmp1_F) VALUES(%s,%s,%s,%s,%s,%s,%s,%s)',(sampleTime,mst1,mst2,mst3,mst4,pot1,ldr1,tmp1))
con.commit() #this is important for live updating
GPIO.output(NPNtrans, False) #turns the probes off
print 'Data Collected, Disengaging Probes \n'
#takes a picture of the plants
print 'Taking Picture with Raspberry Pi Camera Board'
picture_dir = '/home/pi/documents/piplanter/images/'
os.system('raspistill -o ' + picture_dir + str(time.strftime('%m-%d-%y_%H-%M-%S')) + '.jpg')
print 'Capture Successfull: ' + picture_dir + str(time.strftime('%m-%d-%y_%H-%M-%S')) + '.jpg'
#finds the newest image in the directory
print '\nUploading Picture To Flickr'
picture_allfiles = sorted(os.listdir(picture_dir), key=lambda p: os.path.getctime(os.path.join(picture_dir, p)))
picture_newest = picture_dir+picture_allfiles[-1]
print 'File for upload: ' + picture_newest #prints location and file to console
#uploads the picture of the plants to flickr
picture_title = 'Picture @ ' + str(sampleTime)
picture_response = flickr.upload(filename=picture_newest, title=picture_title, format='etree') #uploads the file to flickr
picture_photoID = picture_response.find('photoid').text #gets the id of the photo for constructing a url
print 'Picture Upload Successful, Photo ID: ' + picture_photoID + '\n' #more debug info
time.sleep(10)
#renders the image of the graph
print "Graph Render Start"
global table_code
os.system('php /opt/bitnami/apps/wordpress/htdocs/piplanter/renderScript.php ' + table_code ) #renders the .png file
print "Graph Render Complete \n"
#finds the newest image in the directory
print 'Uploading Graph To Flickr'
graph_allfiles = sorted(os.listdir('/opt/bitnami/apps/wordpress/htdocs/piplanter/renders/'), key=lambda p: os.path.getctime(os.path.join('/opt/bitnami/apps/wordpress/htdocs/piplanter/renders/', p)))
graph_newest = '/opt/bitnami/apps/wordpress/htdocs/piplanter/renders/'+graph_allfiles[-1]
print 'File for upload: ' + graph_newest #prints location and file to console
graph_title = 'Graph @ ' + str(sampleTime)
graph_response = flickr.upload(filename=graph_newest, title=graph_title, format='etree') #uploads the file to flickr
graph_photoID = graph_response.find('photoid').text #gets the id of the photo for constructing a url
print 'Graph Upload Successful, Photo ID: ' + graph_photoID + '\n' #more debug info
#tweets the images and data
send = 'Brghtnss: ' + str(format((((float(ldr1)/1024)*100)),'.0f')) + '% / ' + 'Tmprtr: ' + str(format(tmp1,'.0f')) + ' Dg F' + ' / Avg Plnt Moisture: '+ str(format(float((float((mst1+mst2+mst3+mst4)/4)/1024)*100),'.0f')) + '%' + ' Graph: ' + 'http://www.flickr.com/photos/97350286@N08/'+ str(graph_photoID) + ' Pic: ' + 'http://www.flickr.com/photos/97350286@N08/' + str(picture_photoID) #builds the text of the tweet
print "Tweeting:" , send #for debug purposes
api.update_status(send) #tweets the tweet
time.sleep(.1)
GPIO.output(sampleLED, False)
print "\n-----------end-----------"
def table_update():
global table_number
table_number = table_number + 1
global table_code
table_code = str(time.strftime('%m_%d_%y_%H_%M_%S')) + '__' + str(table_number)
print 'Creating Table: ' + table_code
cursor.execute('USE piplanter')
con.commit()
cursor.execute('CREATE TABLE piplanter_table_'+ table_code +'(Sample_Number INT NOT NULL AUTO_INCREMENT PRIMARY KEY, Time VARCHAR(100), mst1_V VARCHAR(100), mst2_V VARCHAR(100), mst3_V VARCHAR(100), mst4_V VARCHAR(100), pot1_V VARCHAR(100), ldr1_V VARCHAR(100), tmp1_F VARCHAR(100) );')
con.commit()
table_update()
hourlyUpdate()
scheduler = Scheduler(standalone=True)
scheduler.add_interval_job(hourlyUpdate, hours=1)
scheduler.add_interval_job(water, days=1)
scheduler.add_interval_job(table_update, weeks=2)
scheduler.start() #runs the program indefianately once every hour