Bitbucket is great for hosting private git repos. Turns out, it can also be used to turn those repos into python packages that you can integrate into your projects with pip. This took a bit of trial and effort to make happen, let me know if there is anything additional you had to do to get things working on your end and I can add them to the guide.
Background
This whole process is built on pip’s ability to install packages from common VCS’s using SSH keys for access credentials. The syntax for doing that looks like this:
pip install git+ssh://git@bitbucket.org/esologic/sample_project.git
Pretty slick, you can even specify a branch or tag:
pip install git+ssh://git@bitbucket.org/esologic/sample_project.git@master # on the master branch
pip install git+ssh://git@bitbucket.org/esologic/sample_project.git@0.0.2 # on the version tag of 0.0.2
Since this repo is public, let’s try installing the package into a python virtual environment:
(venv) dev@ESO-3:/tmp$ pip install git+ssh://git@bitbucket.org/esologic/sample_project.git
Collecting git+ssh://git@bitbucket.org/esologic/sample_project.git
  Cloning ssh://git@bitbucket.org/esologic/sample_project.git to ./pip-sjec1gbh-build
git@bitbucket.org: Permission denied (publickey).
fatal: Could not read from remote repository.

Please make sure you have the correct access rights
and the repository exists.
Command "git clone -q ssh://git@bitbucket.org/esologic/sample_project.git /tmp/pip-sjec1gbh-build" failed with error code 128 in None
No dice. It didn’t work because our development environment isn’t configured correctly. Let’s get started with the guide.
Using private repo packages locally
Note: I’m on ubuntu 18.04, but I will leave Windows notes in each step if applicable.
Step 1: Make sure your repo CAN be installed as a python package
The key here is a proper
setup.py file.
Here are best the best set of docs I’ve found on how to make this file.
You can also look at the test repo for this project (https://bitbucket.org/esologic/sample_project/src/master/), it contains an example setup.py. This repo will also be the standard example for this post.
To make sure things are working correctly, you can try installing the package into your local python environment, or into a virtual one like I’m doing. Using sample_project as an example, we can do this like so:
(venv) dev@ESO-3:/tmp$ pip install /mnt/c/Users/dev/Documents/misc_git/sample_project/
Processing /mnt/c/Users/dev/Documents/misc_git/sample_project
Installing collected packages: sample-project
  Running setup.py install for sample-project ... done
Successfully installed sample-project-1.0
(venv) dev@ESO-3:/tmp$ python
Python 3.6.8 (default, Jan 14 2019, 11:02:34)
[GCC 8.0.1 20180414 (experimental) [trunk revision 259383]] on linux
Type "help", "copyright", "credits" or "license" for more information.
>>> from sample_project import print_quote
>>> print_quote()
If they can get you asking the wrong questions, they don't have to worry about answers.
>>>
If your package behaves as expected when installed like this locally, you’re all set to push the changes to your bitbucket repo and continue with the rest of the guide.
Step 2: Create SSH keys and add them to bitbucket
Note: at a few places in this step I use my own email as a reference, dev@esologic.com. Make sure whenever you see that, to substitute email address associated with your bitbucket account.
If you already have ssh keys created on your computer or whatever you’re developing on, they should be located at ~/.ssh. If you don’t see both id_rsa and id_rsa.pub files in that directory, create them with:
ssh-keygen -m PEM -t rsa -C "dev@esologic.com"
Leave passphrase blank.
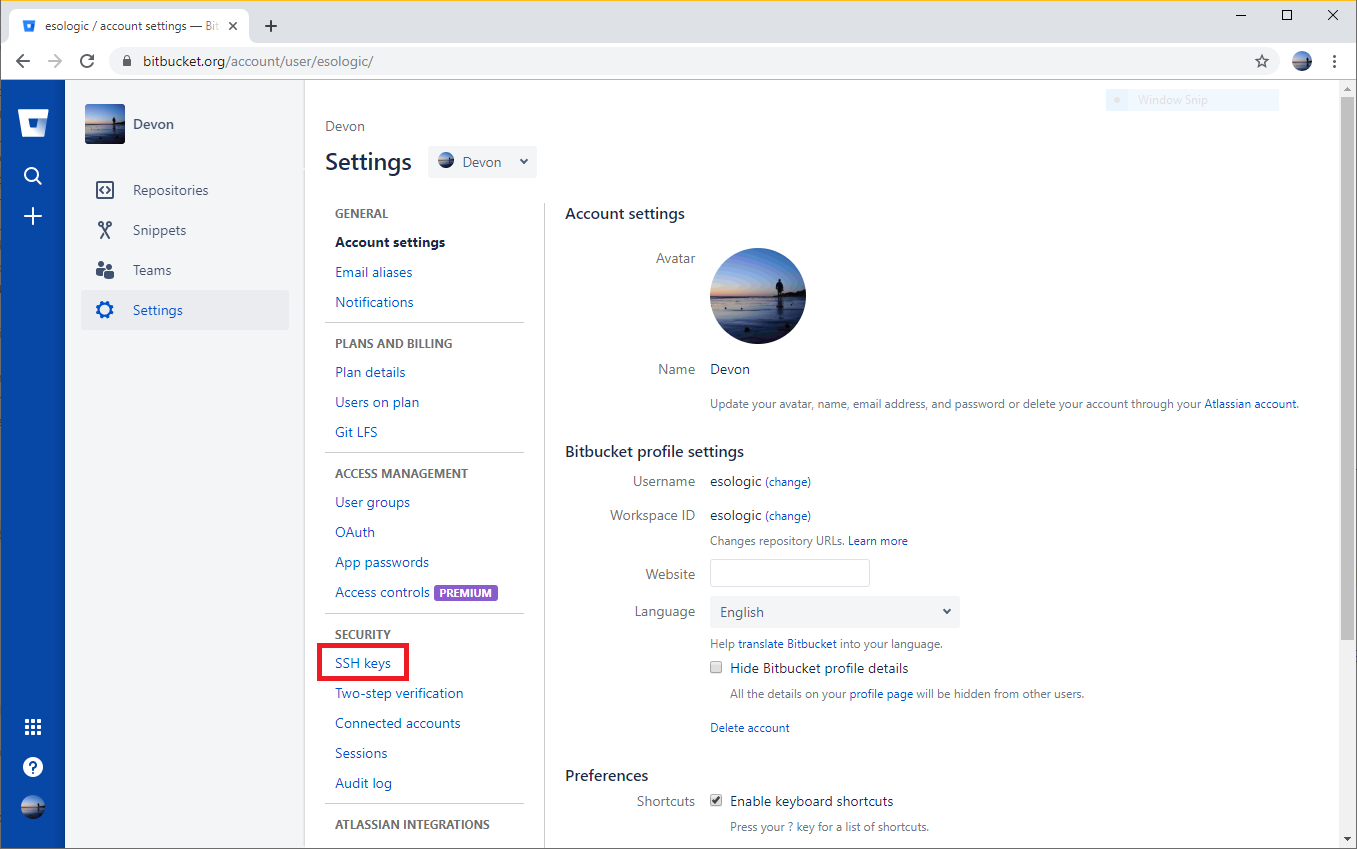
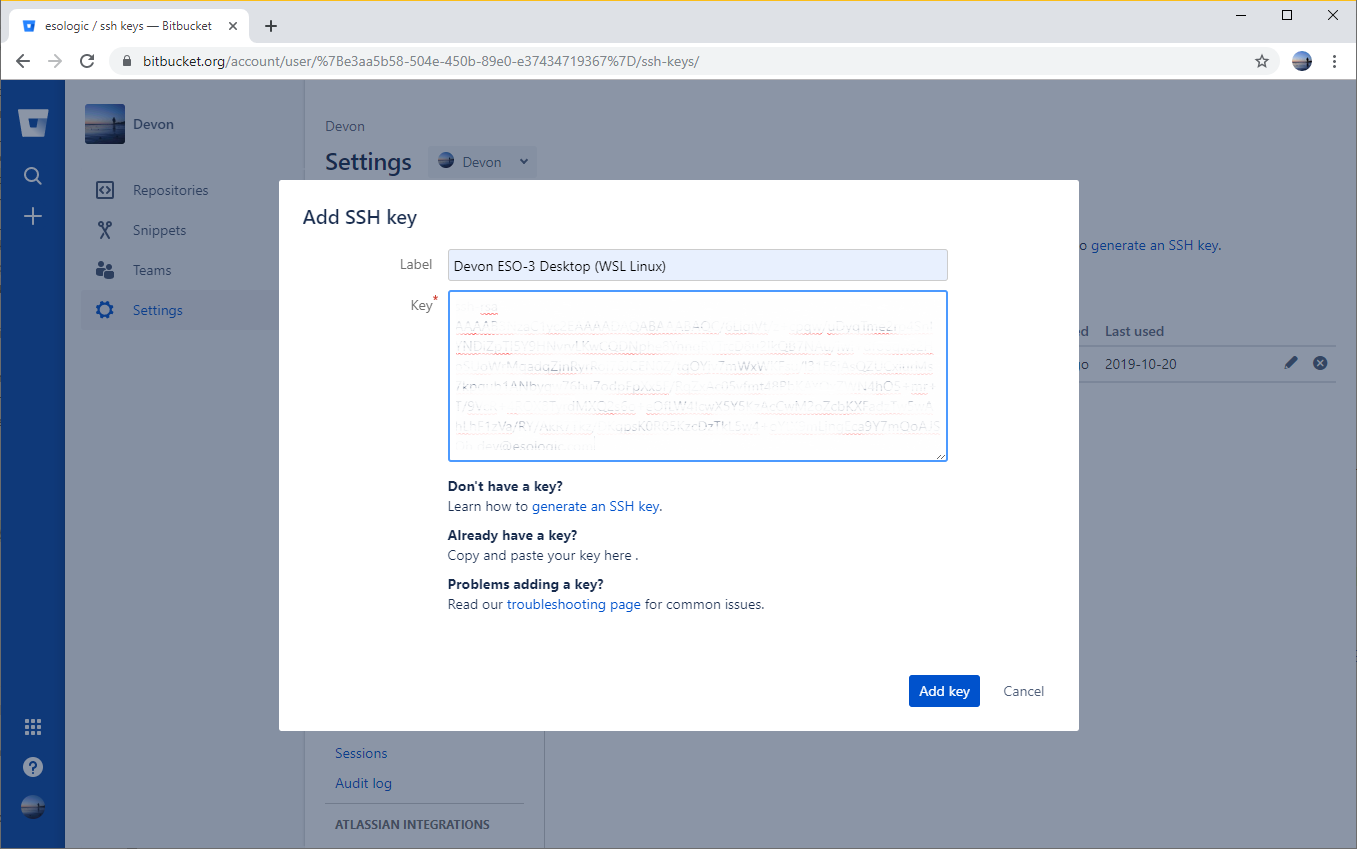
Now, copy the contents of ~/.ssh/id_rsa.pub to bitbucket. The following images should walk you through the steps, make sure to give the key a memorable name.
Now, the ssh key of whatever dev environment you’re on is added to bitbucket.
Windows steps to create ssh keys
I followed these two (
1,
2) guides to create ssh keys on windows.
The short version goes something like this:
$ ssh-keygen -m PEM -t rsa -C "dev@esologic.com" -E md5
$ cd C:\Users\dev\.ssh
$ ssh-add id_rsa
$ ssh -T git@bitbucket.org
Then follow the step above to add the keys to your bitbucket account.
Step 3: Make sure your account can read from the private repo with your python package
This is a simple, but a trap for young players. Make sure the account you’re trying to install the module with has at least read settings on the repo.
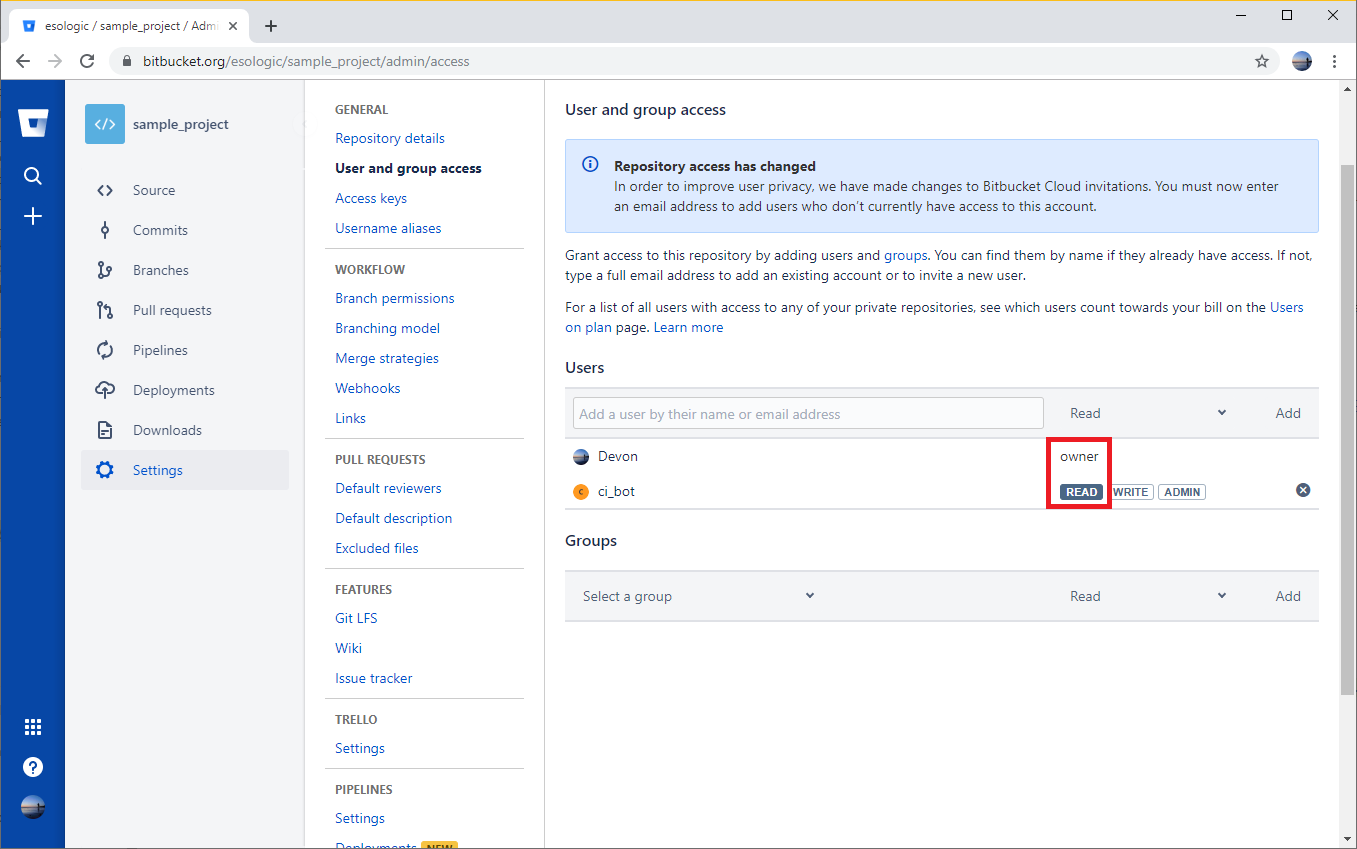
Since the Devon account is an owner of the repo, it will be allowed to read from the repo. The account ci_bot will also be able to read from the repo because it has read permissions.
Step 4: Install the package from bitbucket
With the bitbucket repo permissions set, and your SSH key added to your bitbucket account, you should be able to re-run the installation command from earlier and use the package.
(venv) dev@ESO-3:/tmp$ pip install git+ssh://git@bitbucket.org/esologic/sample_project.git
Collecting git+ssh://git@bitbucket.org/esologic/sample_project.git
  Cloning ssh://git@bitbucket.org/esologic/sample_project.git to ./pip-nkrqsxao-build
setsockopt IPV6_TCLASS 8: Operation not permitted:
Installing collected packages: sample-project
  Running setup.py install for sample-project ... done
Successfully installed sample-project-1.0
(venv) dev@ESO-3:/tmp$ python
Python 3.6.8 (default, Jan 14 2019, 11:02:34)
[GCC 8.0.1 20180414 (experimental) [trunk revision 259383]] on linux
Type "help", "copyright", "credits" or "license" for more information.
>>> import sample_project
>>> sample_project.print_quote()
If they can get you asking the wrong questions, they don't have to worry about answers.
>>>
Fantastic! Remember, your pip command git+ssh://git@bitbucket.org/esologic/sample_project.git will be different for your package. It will look something like this: git+ssh://git@bitbucket.org/{your username}/{your project}.git.
Any user that you give read permissions to on the repo will be able to install your package as well. This includes a
machine user, so your CI builds can use your private package as well, which I’ll show you how to do next.
Using private repo packages in circleci
Bitbucket and
circleci go together like peanut butter and chocolate. Adding CI to a bitbucket project is made fast and easy using circleci.
Step 5: Create a “machine user” in bitbucket
This user should have read only access to the package repo that you want to add to ci, so in this example it’s the sample_project repo.
You can accomplish this very easy through the BB ui, just make sure to keep track of whatever username and password you decide on.
Just to be clear, a machine user is just a regular bitbucket user that is only used by machines.
Step 6: Create SSH keys and add them to your machine user’s account
On whatever you system you have been using so far, enter the following commands and remember to leave passphrase blank.
mkdir ~/.ssh/ci_bot_keys
ssh-keygen -m PEM -t rsa -C "ci_bot@example.com" -f ~/.ssh/ci_bot_keys/id_rsa
Add the contents of ~/.ssh/ci_bot_keys/id_rsa.pub to bitbucket while signed in as your machine user like we did in step 2.
Step 7: Try git+ssh key insertion locally
(Note: you can skip this step, but if things don’t work when you add the step to your CI build start looking for errors here.)
By setting the environment variable GIT_SSH_COMMAND you can select which SSH key gets used by pip when doing an ssh pull.
Let’s try out the concept, and try out our new key locally. Run these two commands:
export SSH_AUTH_SOCK=none
export GIT_SSH_COMMAND='ssh -i ~/.ssh/ci_bot_keys/id_rsa'
And then install your project like you did before. The package should install no problem, and you should see the same output as step 4.
Step 8: Set the `$KEY` environment variable in circleci
We now want to make the private key we made for our ci bot (~/.ssh/ci_bot_keys/id_rsa) available to the circle build process.
The only tricky part here is that the private key will contain newlines. For simplicity, we can replace them with underscores, and add the newlines back in the circle build.
Copy the output of this command to your clipboard:
(venv) dev@ESO-3:/tmp$ cat ~/.ssh/ci_bot_keys/id_rsa | tr "\n" "_"
The output ends after -----END RSA PRIVATE KEY-----_ in case your terminal doesn’t wrap correctly.
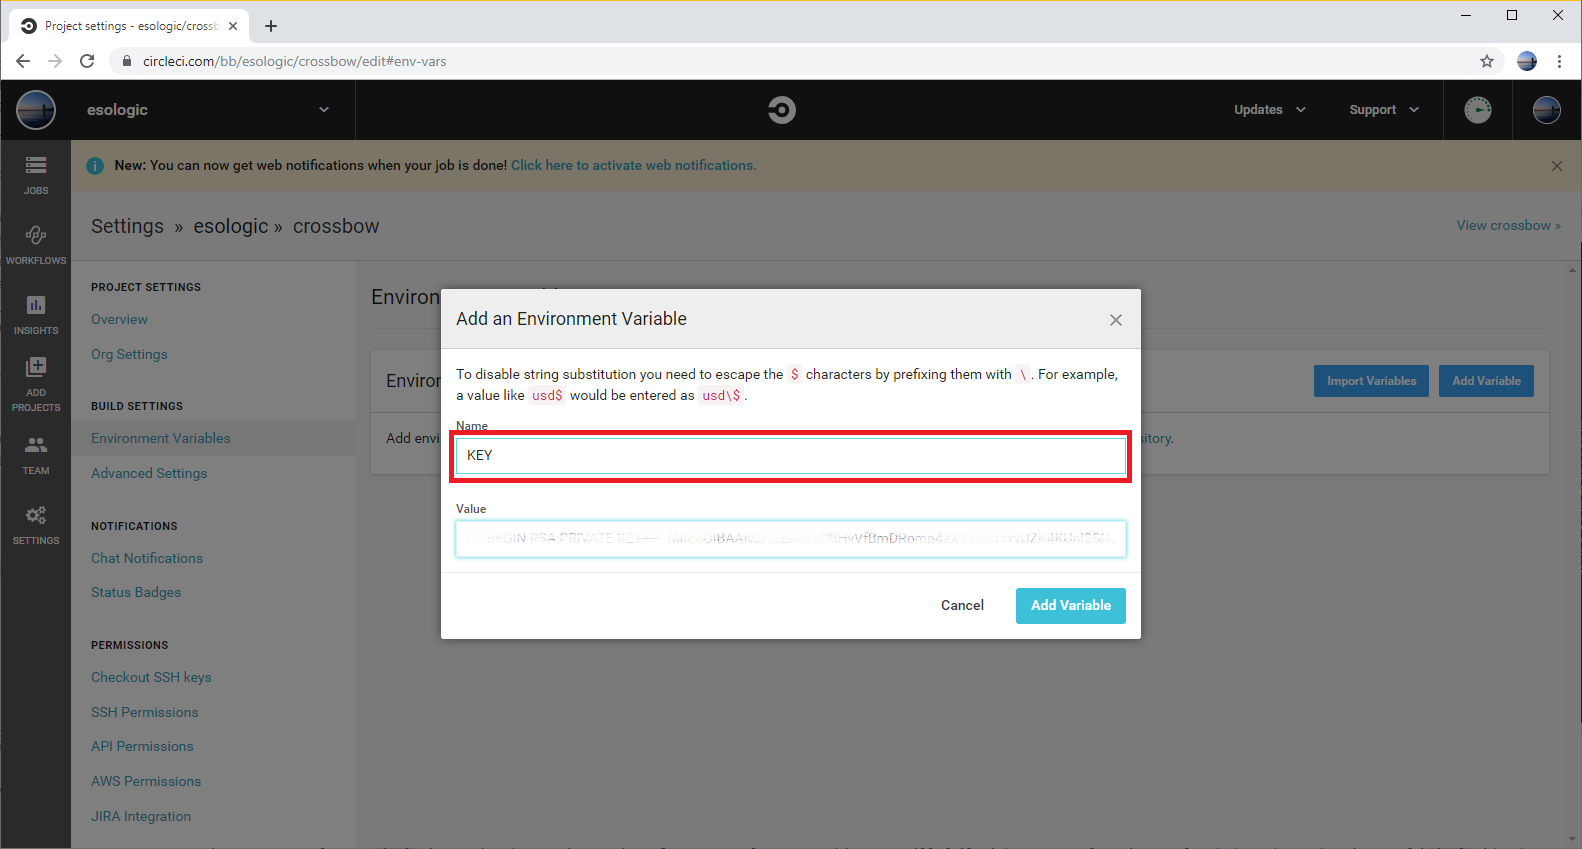
Now we need to set this value to the env var $KEY in the circleci build that we are trying to use our private package (sample_project) in.
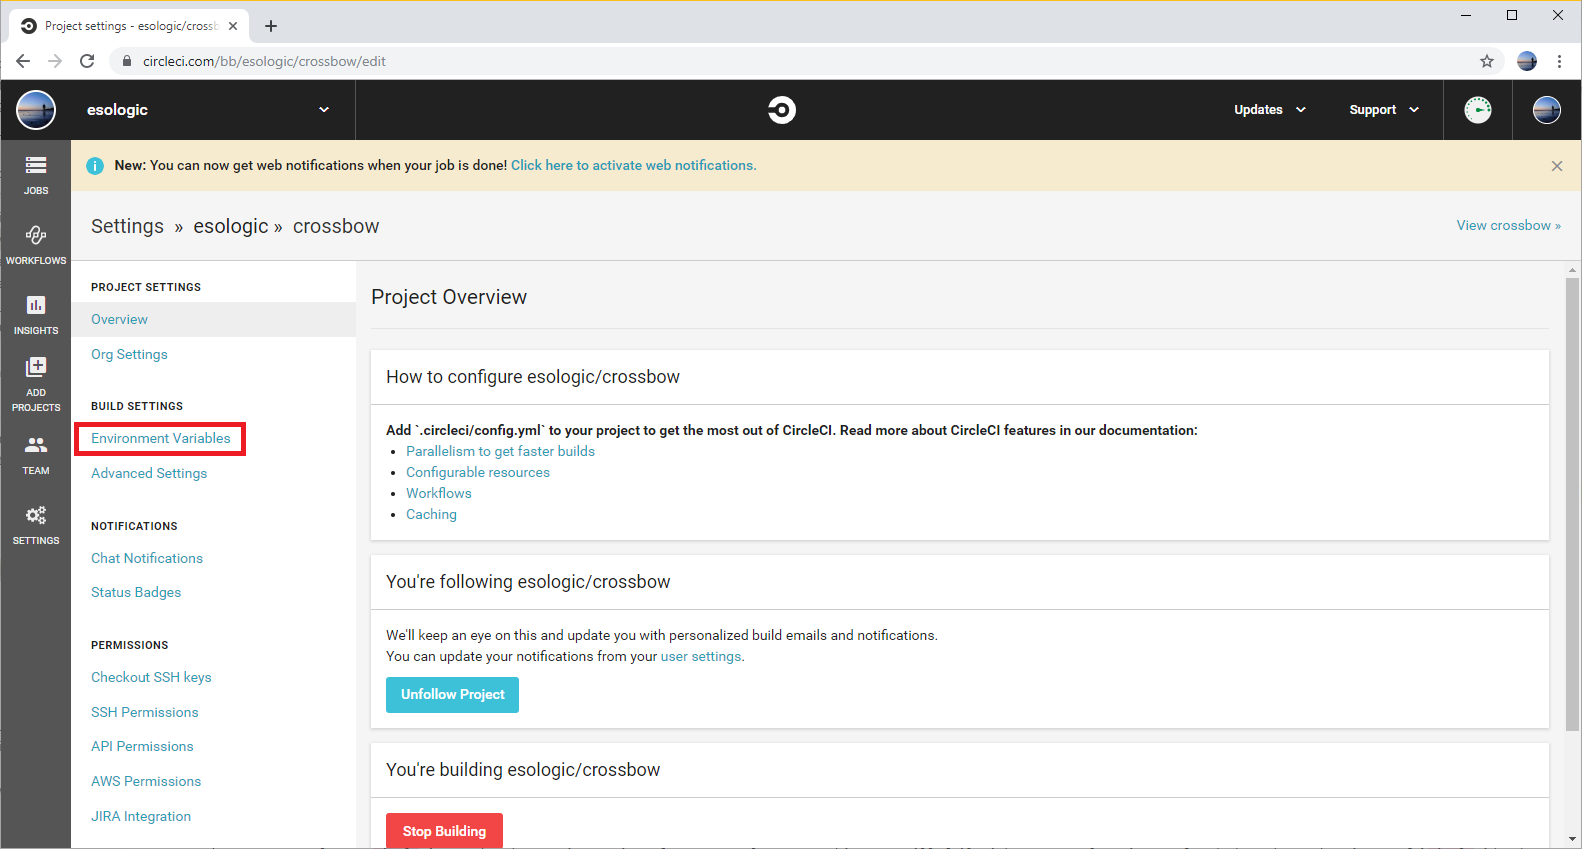
Click the gear on the project page for your project in circle. For me, this brought me to https://circleci.com/bb/esologic/crossbow/edit, where crossbow is the name of my project.
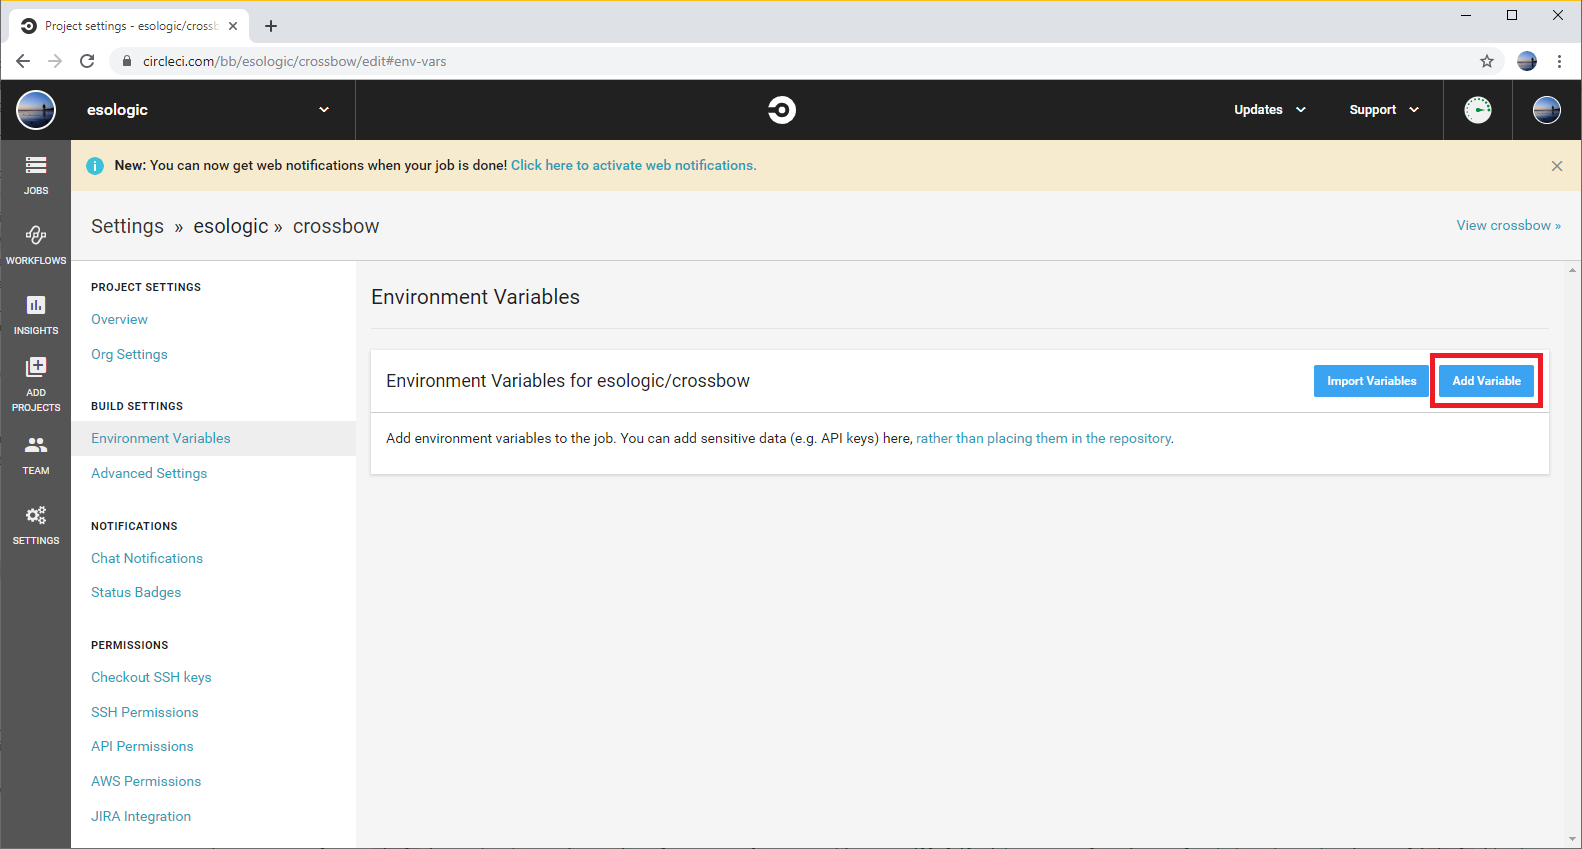
Go to build settings -> Environment Variables and then set the variable like so:
Now that the variable is set, we need to change our circle config to use it.
Step 9: Add the step to your /.circleci/config.yml file
This does the same thing that we just tried locally, but in circle.
You have to make sure that the export GIT_SSH_COMMAND step happens in the same step as any pip commands. Your full dependencies installation circle step may look something like this:
- run:
    name: Install Dependencies
    command: |

      # Give us access to private repos
      export KEY_PATH=tmp_id_rsa
      echo -e "${KEY//_/\\n}" > $KEY_PATH
      chmod 600 $KEY_PATH
      export SSH_AUTH_SOCK=none
      export GIT_SSH_COMMAND='ssh -i $KEY_PATH'

      python3 -m venv venv
      . venv/bin/activate
      pip install -r ./requirements.txtts.txt
Make sure you select a circle image that has a git version of 2.17.0 or later, or this step will fail without an explanation. I found that the python image of circleci/python:3.7-buster worked when testing.
Try running your job, with this step added, it should be able to pull the package from your private repo. Let me know if you run into issues and I can try to help you out. Maybe donate the money you saved on hosting fees to me via paypal? 🤷💖
Thanks to
- http://redgreenrepeat.com/2018/05/25/specifying-different-ssh-key-for-git/