Okay! So I leave for college in less than 30 days, but I’d like to make sure my tomatoes to continue to grow once I leave so I’ve taken some steps to make sure that my departure goes smoothly.
Here’s a video of my revised setup:
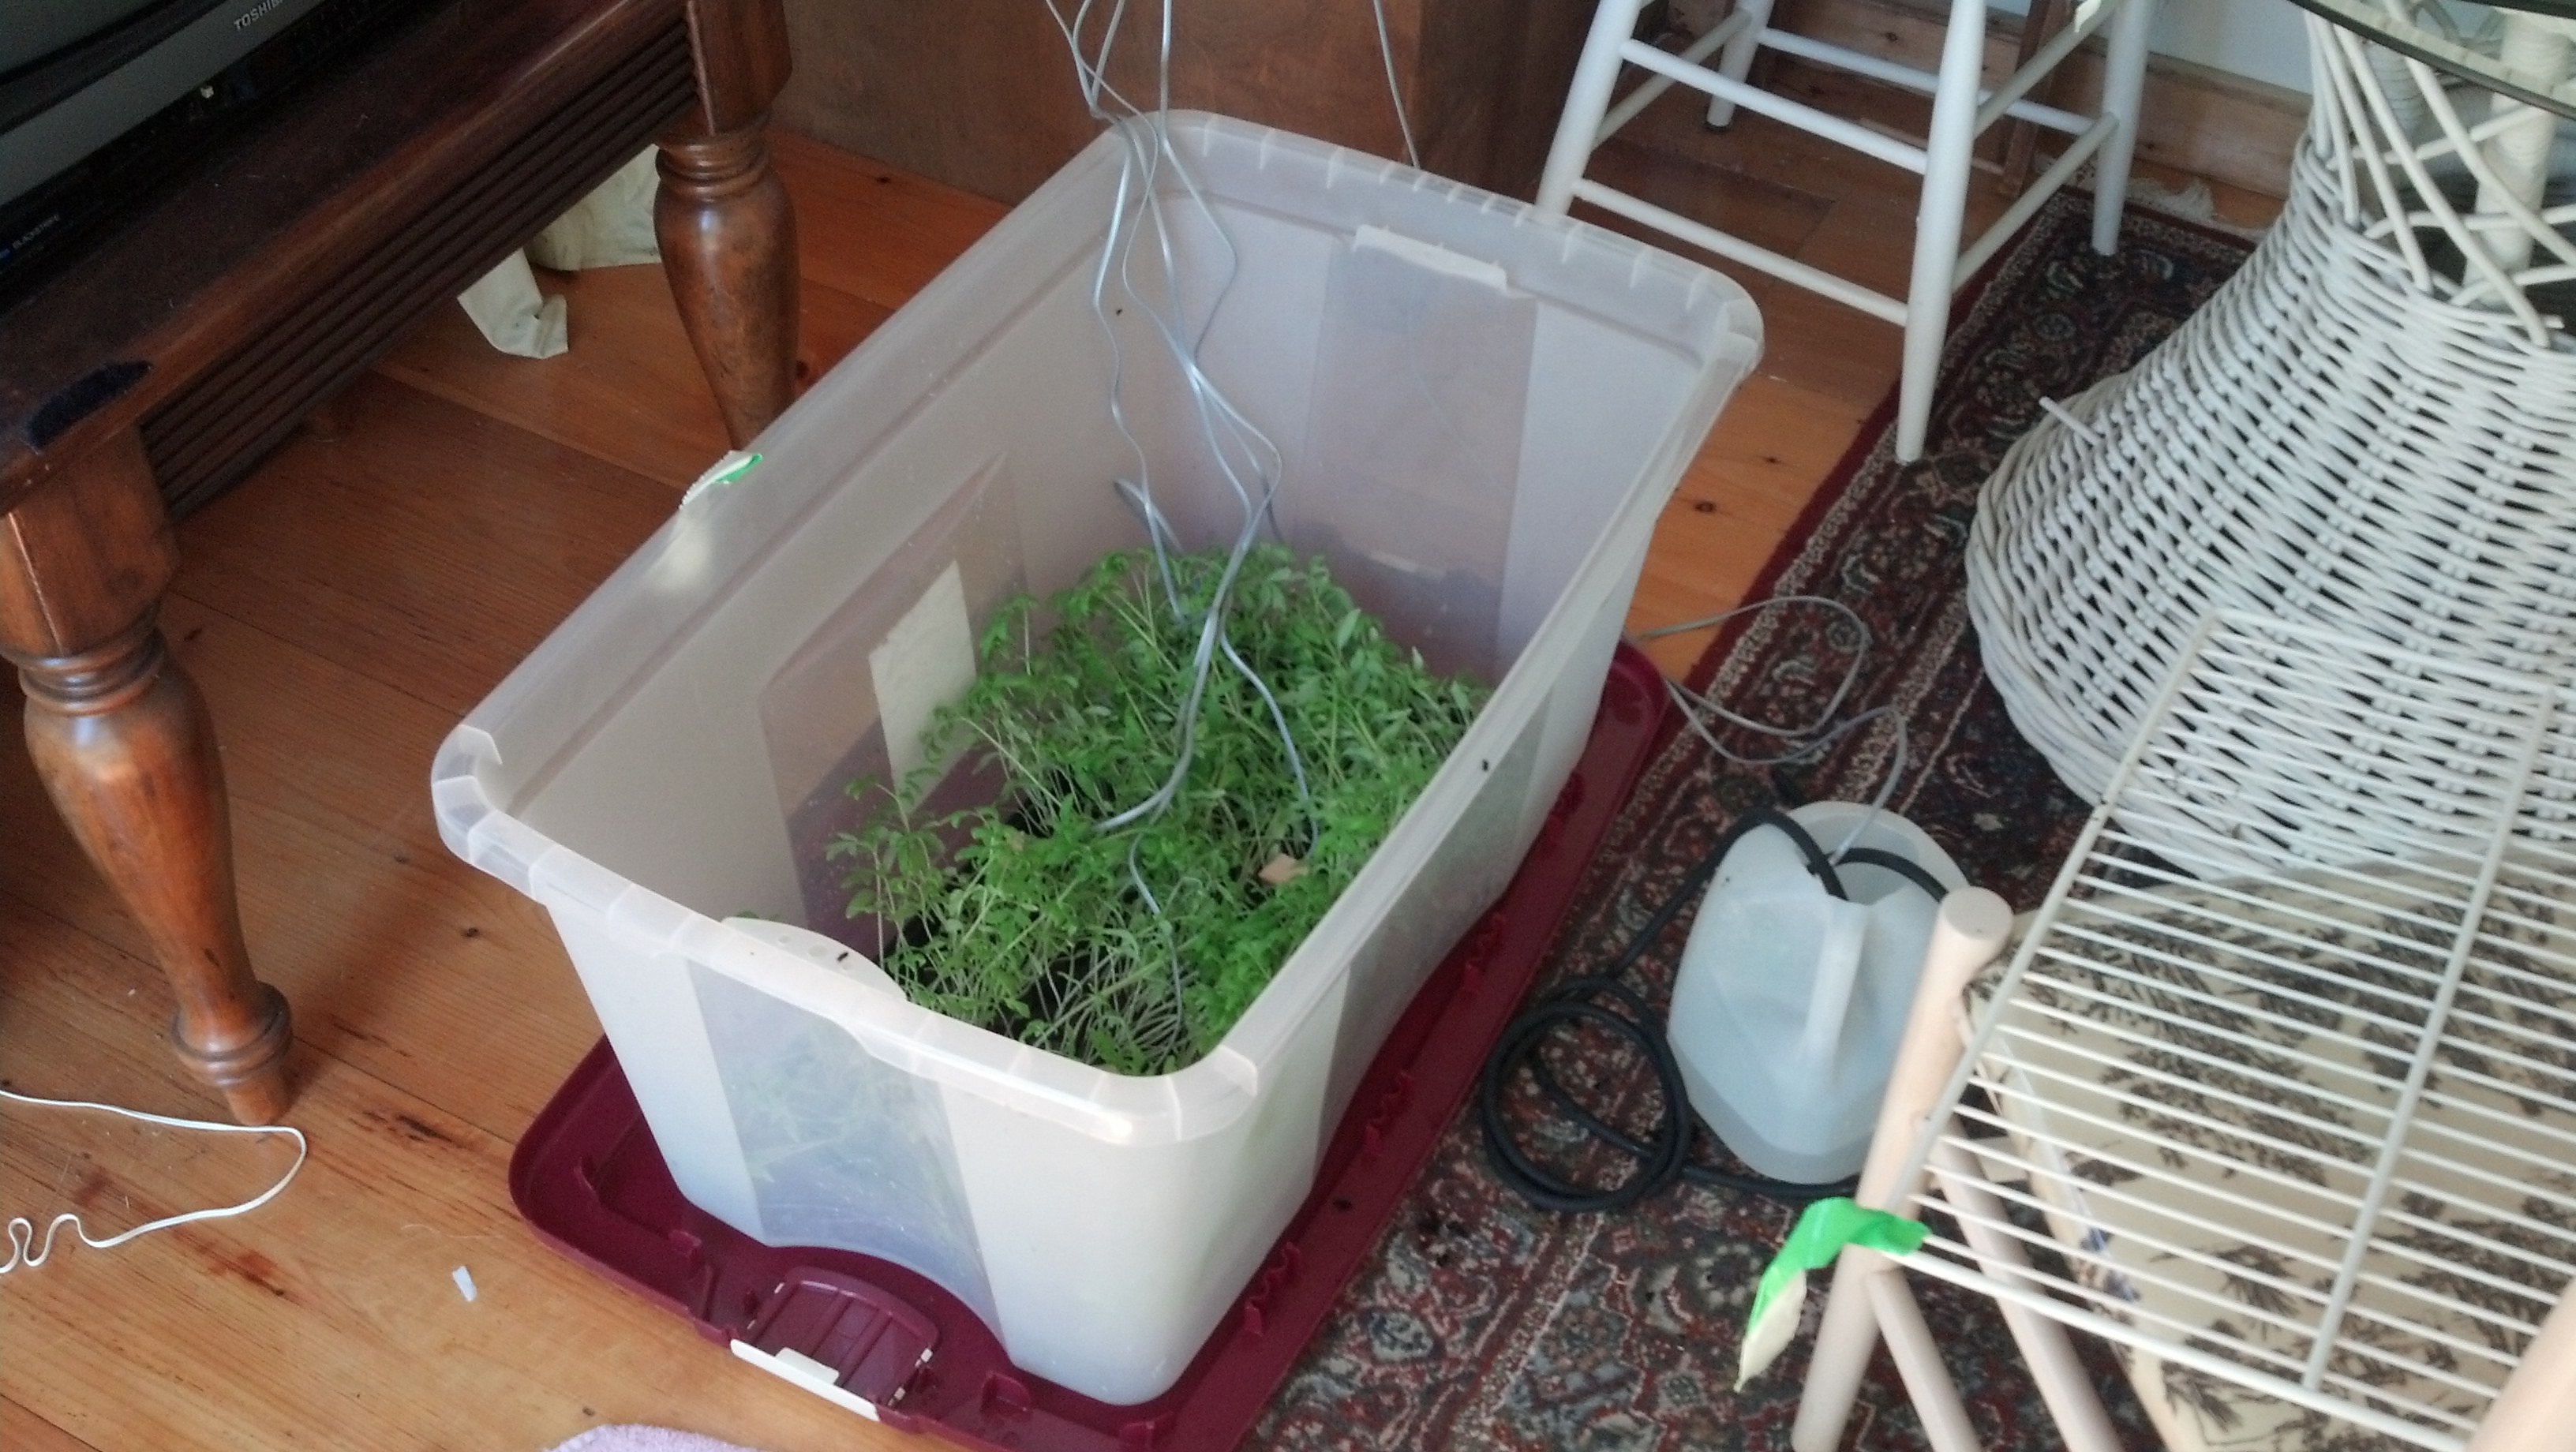
There are a few key differences between this setup and my previous one:
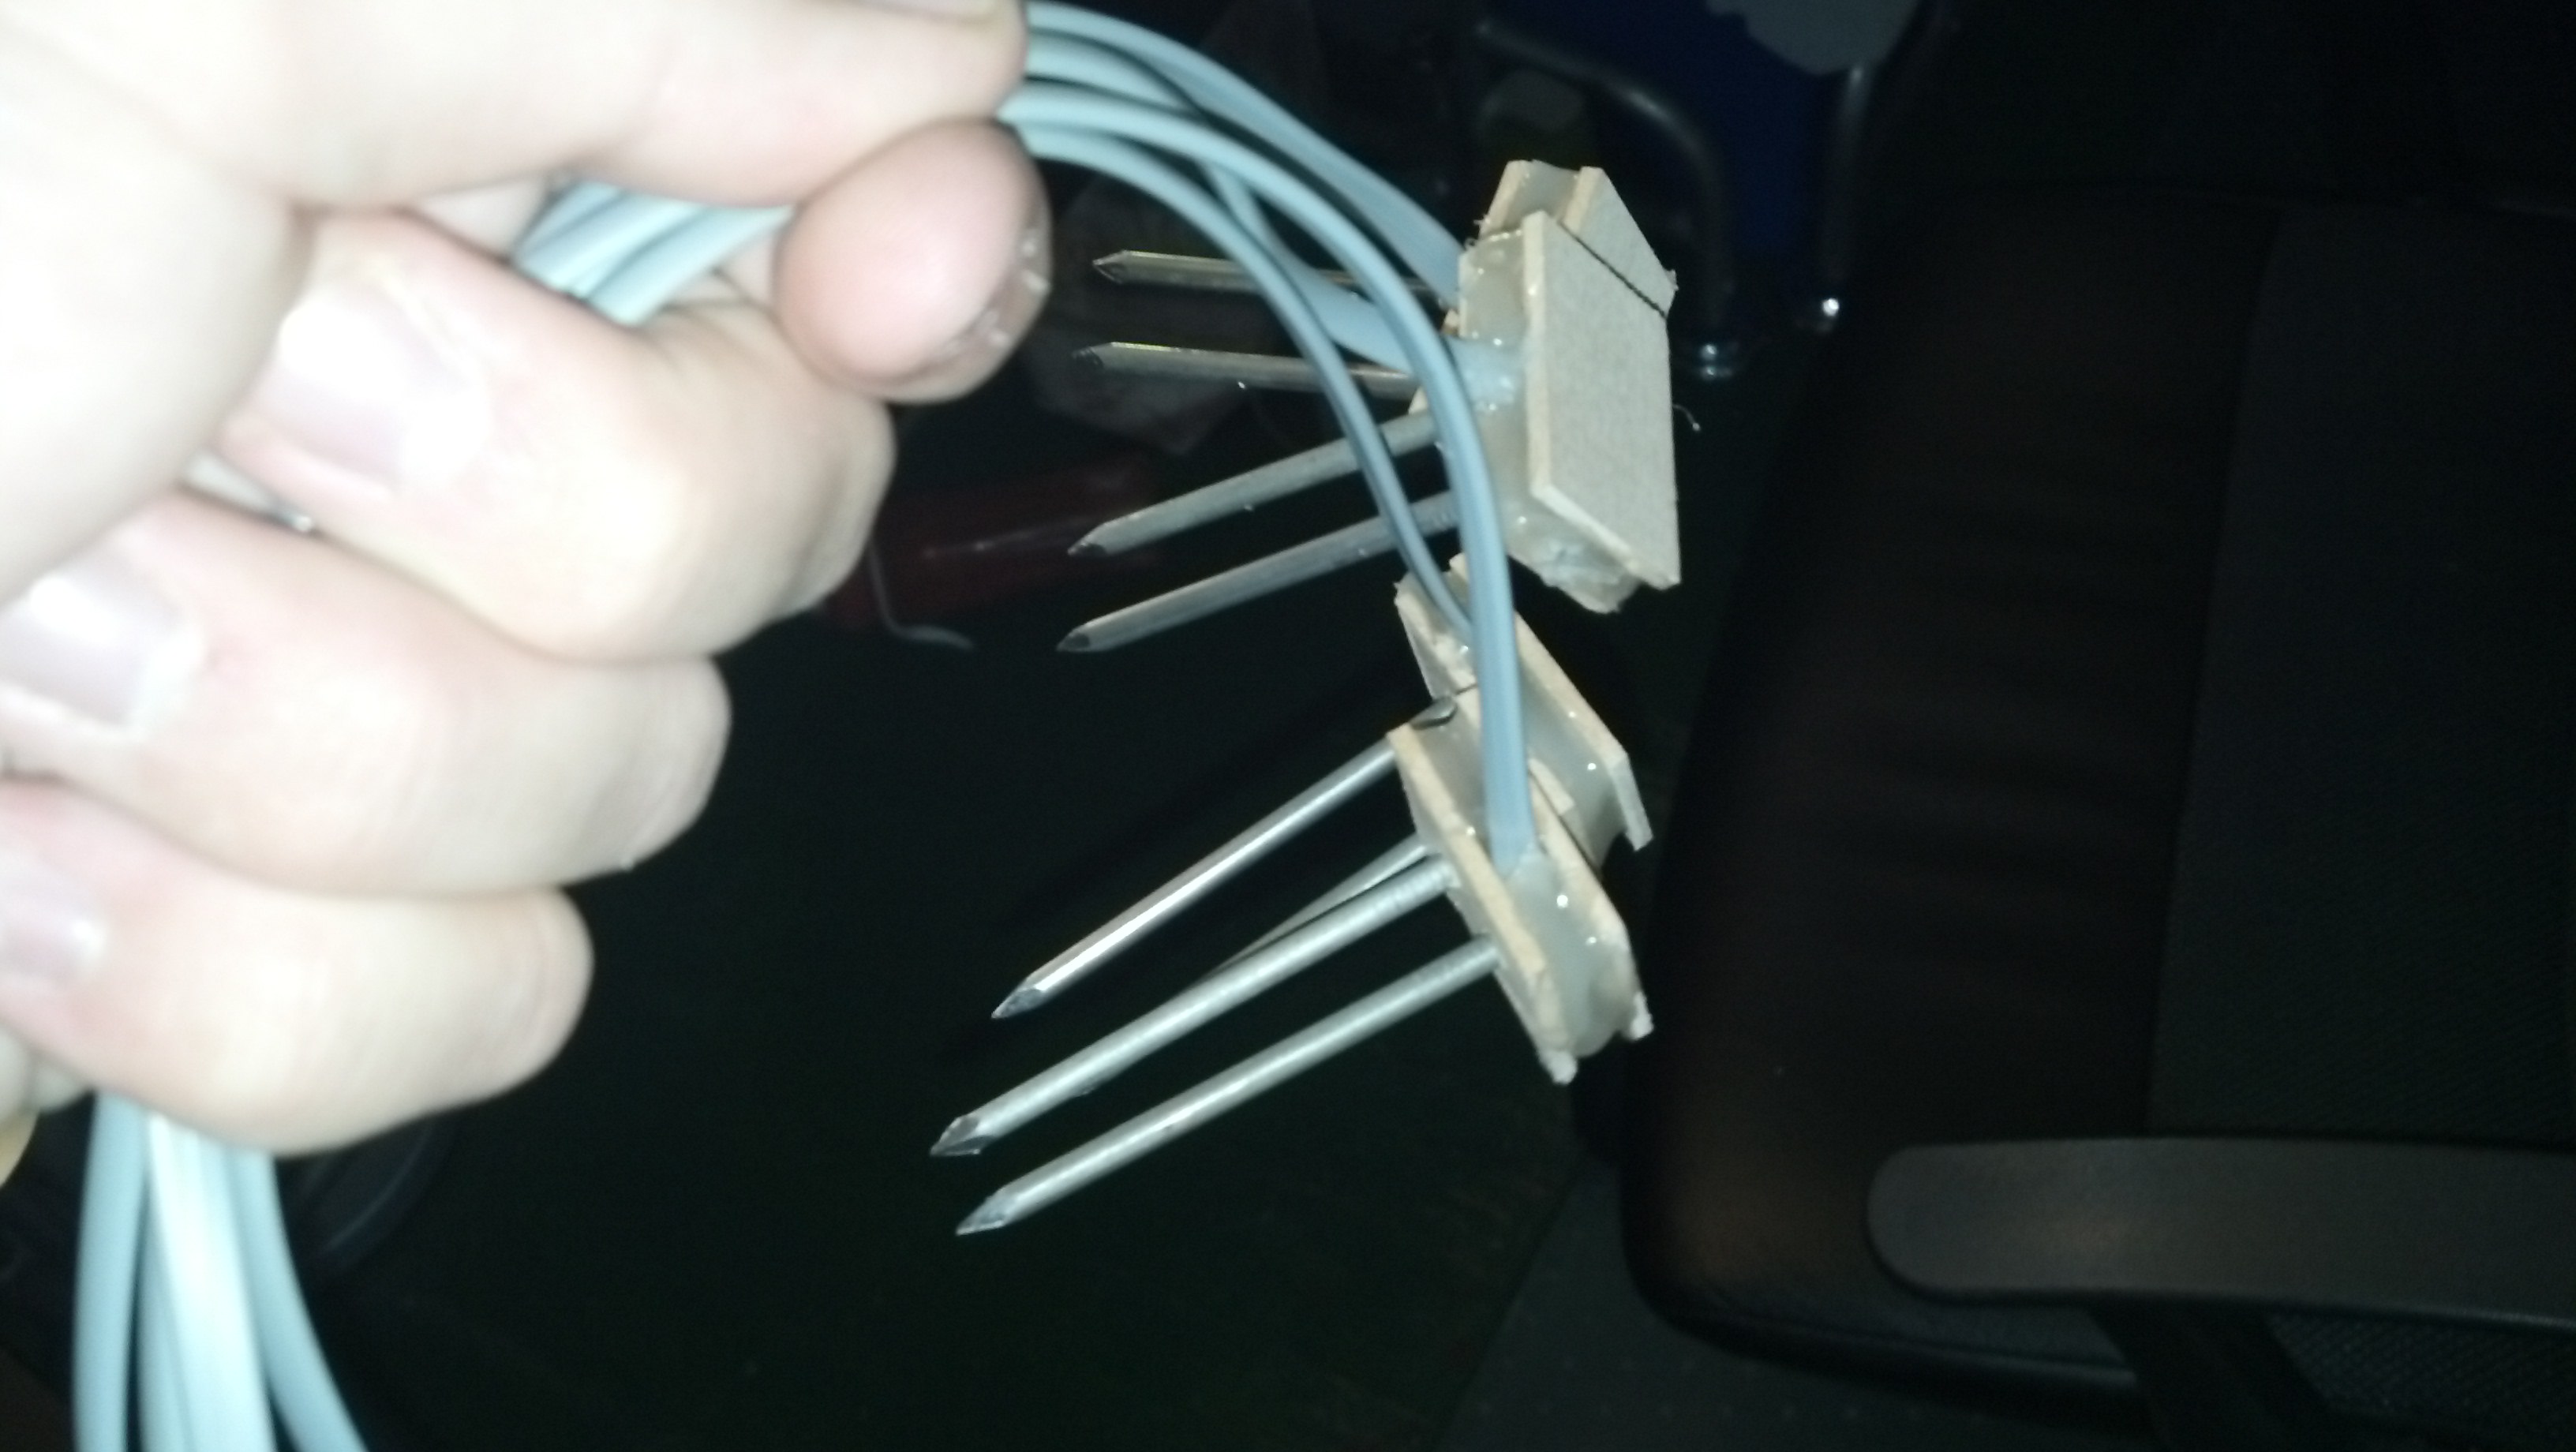
The main one is that the watering system has been 100% re-vamped. The water distribution happens via a hose with holes in it instead of using the tray at the bottom of the plant grid in the previous video.
It also takes, uploads and tweets a picture of itself using a raspberry pi camera module.
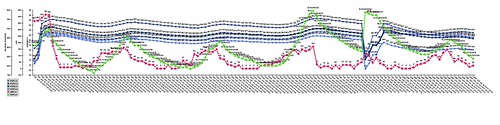
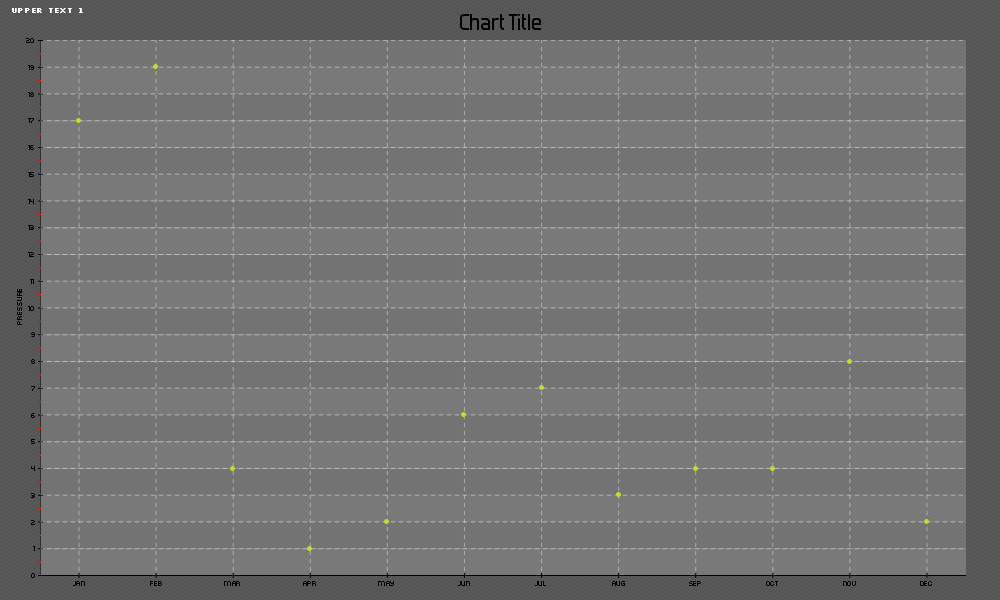
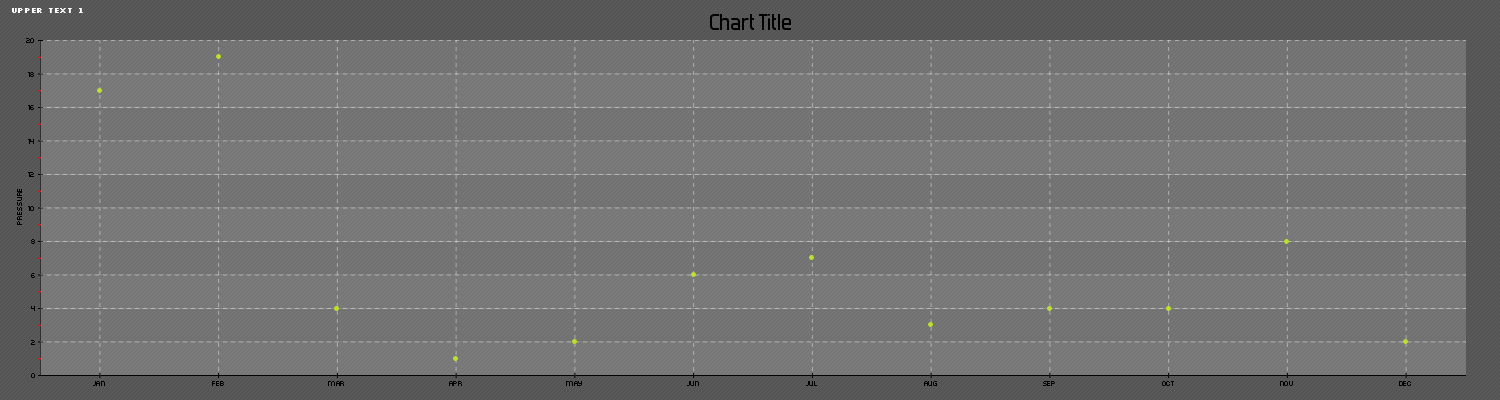
It also creates a new mysql table every two weeks, and in turn, renders a new kind of graph. The renderscript.php file receives an argument from the python script which is the table code.
Here’s the python script:
|
1 2 3 4 5 6 7 8 9 10 11 12 13 14 15 16 17 18 19 20 21 22 23 24 25 26 27 28 29 30 31 32 33 34 35 36 37 38 39 40 41 42 43 44 45 46 47 48 49 50 51 52 53 54 55 56 57 58 59 60 61 62 63 64 65 66 67 68 69 70 71 72 73 74 75 76 77 78 79 80 81 82 83 84 85 86 87 88 89 90 91 92 93 94 95 96 97 98 99 100 101 102 103 104 105 106 107 108 109 110 111 112 113 114 115 116 117 118 119 120 121 122 123 124 125 126 127 128 129 130 131 132 133 134 135 136 137 138 139 140 141 142 143 144 145 146 147 148 149 150 151 152 153 154 155 156 157 158 159 160 161 162 163 164 165 166 167 168 169 170 171 172 173 174 175 176 177 178 179 180 181 182 183 184 185 186 187 188 189 190 191 192 193 194 195 196 197 198 199 200 201 202 203 204 205 206 207 208 209 210 211 212 213 214 215 216 217 218 219 220 221 222 223 224 225 226 227 228 229 230 231 232 233 234 235 236 237 238 239 240 241 242 243 244 245 246 247 248 249 250 251 252 253 254 255 256 257 258 259 260 261 262 |
#Timing setup from datetime import datetime from apscheduler.scheduler import Scheduler import time import datetime import sys import os now =datetime.datetime.now() #import logging #if you start getting logging errors, uncomment these two lines #logging.basicConfig() #GPIO setup import RPi.GPIO as GPIO GPIO.setmode(GPIO.BOARD) GPIO.cleanup() pin = 26 #pin for the adc GPIO.setup(pin, GPIO.OUT) NPNtrans = 3 #the pin for the npn transistor GPIO.setup(NPNtrans, GPIO.OUT) sampleLED = 5 #the indicator LED GPIO.setup(sampleLED, GPIO.OUT) pump = 7 #pin for the pump GPIO.setup(pump, GPIO.OUT) GPIO.output(pump, False) #the adc's SPI setup import spidev spi = spidev.SpiDev() spi.open(0, 0) #sets up the program's ability to write to a mysql database import MySQLdb con = MySQLdb.connect('localhost','piplanter_user','piplanter_pass','piplanter'); cursor = con.cursor() #tweepy setup, you must use the keys given to you when you create your app import tweepy consumer_key="" consumer_secret="" access_token="" access_token_secret="" #"logs in" to twitter, auth = tweepy.OAuthHandler(consumer_key, consumer_secret) auth.set_access_token(access_token, access_token_secret) api = tweepy.API(auth) #Flickr Setup import flickrapi api_key = '' api_secret = '' flickr = flickrapi.FlickrAPI(api_key, api_secret, format='json') (token, frob) = flickr.get_token_part_one(perms='write') if not token: raw_input("Press ENTER after you authorized this program") flickr.get_token_part_two((token, frob)) #Variable Setup ontime = 60 global table_number table_number = 0 #fuction that can read the adc def readadc(adcnum): # read SPI data from MCP3008 chip, 8 possible adc's (0 thru 7) if adcnum > 7 or adcnum < 0: return -1 r = spi.xfer2([1, 8 + adcnum << 4, 0]) adcout = ((r[1] & 3) << 8) + r[2] return adcout def water(): print "===== Starting Watering Process =====" GPIO.output(NPNtrans, True) GPIO.output(sampleLED, True) time.sleep(1) sensor1_before = readadc(0) sensor2_before = readadc(1) sensor3_before = readadc(2) sensor4_before = readadc(3) before = "WATERING START / Moisture Before - " + "Sensor 1:" + str(sensor1_before) + " Sensor 2:" + str(sensor2_before) + " Sensor 3:" + str(sensor3_before) + " Sensor 4:" + str(sensor4_before) + " - Average:" + str((float(sensor1_before+sensor2_before+sensor3_before+sensor4_before)/4)) api.update_status(before) print before GPIO.output(pump, True) time.sleep(ontime) GPIO.output(pump, False) time.sleep(60) #gives the water time to penetrate the soil sensor1_after = readadc(0) sensor2_after = readadc(1) sensor3_after = readadc(2) sensor4_after = readadc(3) after = "WATERING COMPLETED / Moisture After - " + "Sensor 1:" + str(sensor1_after) + " Sensor 2:" + str(sensor2_after) + " Sensor 3:" + str(sensor3_after) + " Sensor 4:" + str(sensor4_after) + " - Average: " + str((float(sensor1_after+sensor2_after+sensor3_after+sensor4_after)/4)) api.update_status(after) print after GPIO.output(NPNtrans, False) GPIO.output(sampleLED, False) print "====== Watering Process Complete =====" def hourlyUpdate(): GPIO.output(pump, False) print "----------start----------\n" GPIO.output(NPNtrans, True) GPIO.output(sampleLED, True) time.sleep(1) sampleTime = time.ctime() mst1 = 1024-readadc(0) mst2 = 1024-readadc(1) mst3 = 1024-readadc(2) mst4 = 1024-readadc(3) pot1 = readadc(4) ldr1 = readadc(5) millivolts = readadc(6)*(3300.0/1024.0) temp_c = ((millivolts - 100.0)/10)-40.0 tmp1 = (temp_c * 9.0 / 5.0) + 32 print 'Polling Probes \n' #prints debug info to console print sampleTime,"|","MST1:",mst1,"MST2:",mst2,"MST3:",mst3,"MST4:",mst4,"Pot1:",pot1,"LDR1:",ldr1,"TMP1:",tmp1 #prints the debug info global table_number print 'Adding Data To Table: ' + str(table_number) #adds the data to the mysql table global table_number cursor.execute('INSERT INTO piplanter_table_'+ table_code +'(Time,mst1_V,mst2_V,mst3_V,mst4_V,pot1_V,ldr1_V,tmp1_F) VALUES(%s,%s,%s,%s,%s,%s,%s,%s)',(sampleTime,mst1,mst2,mst3,mst4,pot1,ldr1,tmp1)) con.commit() #this is important for live updating GPIO.output(NPNtrans, False) #turns the probes off print 'Data Collected, Disengaging Probes \n' #takes a picture of the plants print 'Taking Picture with Raspberry Pi Camera Board' picture_dir = '/home/pi/documents/piplanter/images/' os.system('raspistill -o ' + picture_dir + str(time.strftime('%m-%d-%y_%H-%M-%S')) + '.jpg') print 'Capture Successfull: ' + picture_dir + str(time.strftime('%m-%d-%y_%H-%M-%S')) + '.jpg' #finds the newest image in the directory print '\nUploading Picture To Flickr' picture_allfiles = sorted(os.listdir(picture_dir), key=lambda p: os.path.getctime(os.path.join(picture_dir, p))) picture_newest = picture_dir+picture_allfiles[-1] print 'File for upload: ' + picture_newest #prints location and file to console #uploads the picture of the plants to flickr picture_title = 'Picture @ ' + str(sampleTime) picture_response = flickr.upload(filename=picture_newest, title=picture_title, format='etree') #uploads the file to flickr picture_photoID = picture_response.find('photoid').text #gets the id of the photo for constructing a url print 'Picture Upload Successful, Photo ID: ' + picture_photoID + '\n' #more debug info time.sleep(10) #renders the image of the graph print "Graph Render Start" global table_code os.system('php /opt/bitnami/apps/wordpress/htdocs/piplanter/renderScript.php ' + table_code ) #renders the .png file print "Graph Render Complete \n" #finds the newest image in the directory print 'Uploading Graph To Flickr' graph_allfiles = sorted(os.listdir('/opt/bitnami/apps/wordpress/htdocs/piplanter/renders/'), key=lambda p: os.path.getctime(os.path.join('/opt/bitnami/apps/wordpress/htdocs/piplanter/renders/', p))) graph_newest = '/opt/bitnami/apps/wordpress/htdocs/piplanter/renders/'+graph_allfiles[-1] print 'File for upload: ' + graph_newest #prints location and file to console graph_title = 'Graph @ ' + str(sampleTime) graph_response = flickr.upload(filename=graph_newest, title=graph_title, format='etree') #uploads the file to flickr graph_photoID = graph_response.find('photoid').text #gets the id of the photo for constructing a url print 'Graph Upload Successful, Photo ID: ' + graph_photoID + '\n' #more debug info #tweets the images and data send = 'Brghtnss: ' + str(format((((float(ldr1)/1024)*100)),'.0f')) + '% / ' + 'Tmprtr: ' + str(format(tmp1,'.0f')) + ' Dg F' + ' / Avg Plnt Moisture: '+ str(format(float((float((mst1+mst2+mst3+mst4)/4)/1024)*100),'.0f')) + '%' + ' Graph: ' + 'http://www.flickr.com/photos/97350286@N08/'+ str(graph_photoID) + ' Pic: ' + 'http://www.flickr.com/photos/97350286@N08/' + str(picture_photoID) #builds the text of the tweet print "Tweeting:" , send #for debug purposes api.update_status(send) #tweets the tweet time.sleep(.1) GPIO.output(sampleLED, False) print "\n-----------end-----------" def table_update(): global table_number table_number = table_number + 1 global table_code table_code = str(time.strftime('%m_%d_%y_%H_%M_%S')) + '__' + str(table_number) print 'Creating Table: ' + table_code cursor.execute('USE piplanter') con.commit() cursor.execute('CREATE TABLE piplanter_table_'+ table_code +'(Sample_Number INT NOT NULL AUTO_INCREMENT PRIMARY KEY, Time VARCHAR(100), mst1_V VARCHAR(100), mst2_V VARCHAR(100), mst3_V VARCHAR(100), mst4_V VARCHAR(100), pot1_V VARCHAR(100), ldr1_V VARCHAR(100), tmp1_F VARCHAR(100) );') con.commit() table_update() hourlyUpdate() scheduler = Scheduler(standalone=True) scheduler.add_interval_job(hourlyUpdate, hours=1) scheduler.add_interval_job(water, days=1) scheduler.add_interval_job(table_update, weeks=2) scheduler.start() #runs the program indefianately once every hour |
Here’s the .php script:
|
1 2 3 4 5 6 7 8 9 10 11 12 13 14 15 16 17 18 19 20 21 22 23 24 25 26 27 28 29 30 31 32 33 34 35 36 37 38 39 40 41 42 43 44 45 46 47 48 49 50 51 52 53 54 55 56 57 58 59 60 61 62 63 64 65 66 67 68 69 70 71 72 73 74 75 76 77 78 79 80 81 82 83 84 85 86 |
<?php /* Include all the classes */ include("/srv/www/lib/pChart/class/pData.class.php"); include("/srv/www/lib/pChart/class/pDraw.class.php"); include("/srv/www/lib/pChart/class/pImage.class.php"); $myData = new pData(); /* Create your dataset object */ $db = mysql_connect("localhost", "piplanter_user", "piplanter_pass"); //location of server, db username, db pass mysql_select_db("piplanter", $db); $Requete = "SELECT * FROM `piplanter_table_" . $argv[1] . "`"; //table name $Result = mysql_query($Requete, $db); /*This fetches the data from the mysql database, and adds it to pchart as points*/ while($row = mysql_fetch_array($Result)) { $Time = $row["Time"]; $myData->addPoints($Time,"Time"); $mst1_V = $row["mst1_V"]; $myData->addPoints($mst1_V,"mst1_V"); $mst2_V = $row["mst2_V"]; $myData->addPoints($mst2_V,"mst2_V"); $mst3_V = $row["mst3_V"]; $myData->addPoints($mst3_V,"mst3_V"); $mst4_V = $row["mst4_V"]; $myData->addPoints($mst4_V,"mst4_V"); $ldr1_V = $row["ldr1_V"]; $myData->addPoints($ldr1_V,"ldr1_V"); $tmp1_F = $row["tmp1_F"]; $myData->addPoints($tmp1_F,"tmp1_F"); } $myData-> setSerieOnAxis("tmp1_F", 0); //assigns the data to the frist axis $myData-> setAxisName(0, "Degrees F"); //adds the label to the first axis $myData-> setSerieOnAxis("ldr1_V", 1); $myData-> setAxisName(1, "LDR"); $myData-> setSerieOnAxis("mst1_V", 2); $myData-> setSerieWeight("mst1_V",2); $myData-> setSerieOnAxis("mst2_V", 2); $myData-> setSerieOnAxis("mst3_V", 2); $myData-> setSerieOnAxis("mst4_V", 2); $myData-> setAxisName(2, "Relative Moisture"); $myData->setAbscissa("Time"); //sets the time data set as the x axis label $myData-> setSerieWeight("mst1_V",1); //draws the line tickness $myData->setPalette("mst1_V",array("R"=>58,"G"=>95,"B"=>205,"Alpha"=>80)); //sets the line color $myData-> setSerieWeight("mst2_V",1); $myData->setPalette("mst2_V",array("R"=>39,"G"=>64,"B"=>139,"Alpha"=>80)); $myData-> setSerieWeight("mst3_V",1); $myData->setPalette("mst3_V",array("R"=>0,"G"=>34,"B"=>102,"Alpha"=>80)); $myData-> setSerieWeight("mst4_V",1); $myData->setPalette("mst4_V",array("R"=>67,"G"=>110,"B"=>238,"Alpha"=>80)); $myData-> setSerieWeight("ldr1_V",2); $myData-> setSerieTicks("ldr1_V", 4); $myData-> setSerieWeight("tmp1_F",2); $myData-> setSerieTicks("tmp1_F", 4); $myPicture = new pImage(4000,500,$myData); /* Create a pChart object and associate your dataset */ $myPicture->setFontProperties(array("FontName"=>"/srv/www/lib/pChart/fonts/pf_arma_five.ttf","FontSize"=>6)); /* Choose a nice font */ $myPicture->setGraphArea(130,40,3900,300); /* Define the boundaries of the graph area */ $myPicture->drawScale(array("LabelRotation"=>320)); /* Draw the scale, keep everything automatic */ $Settings = array("R"=>250, "G"=>250, "B"=>250, "Dash"=>1, "DashR"=>0, "DashG"=>0, "DashB"=>0); /*The combination makes a cool looking graph*/ $myPicture->drawPlotChart(array("DisplayValues"=>TRUE)); $myPicture->drawLineChart(); $myPicture->drawLegend(30,320); //adds the legend //$date-> date("d-M-Y:H:i:s"); //$myPicture->autoOutput(); /* Build the PNG file and send it to the web browser */ $myPicture->render("/opt/bitnami/apps/wordpress/htdocs/piplanter/renders/".date("d-M-Y_H:i:s").".png"); ?> |
Thank you for reading!