Last night I finished the majority of the software for this project. Here’s a video of me going over what happened and what the program does in simpler terms:
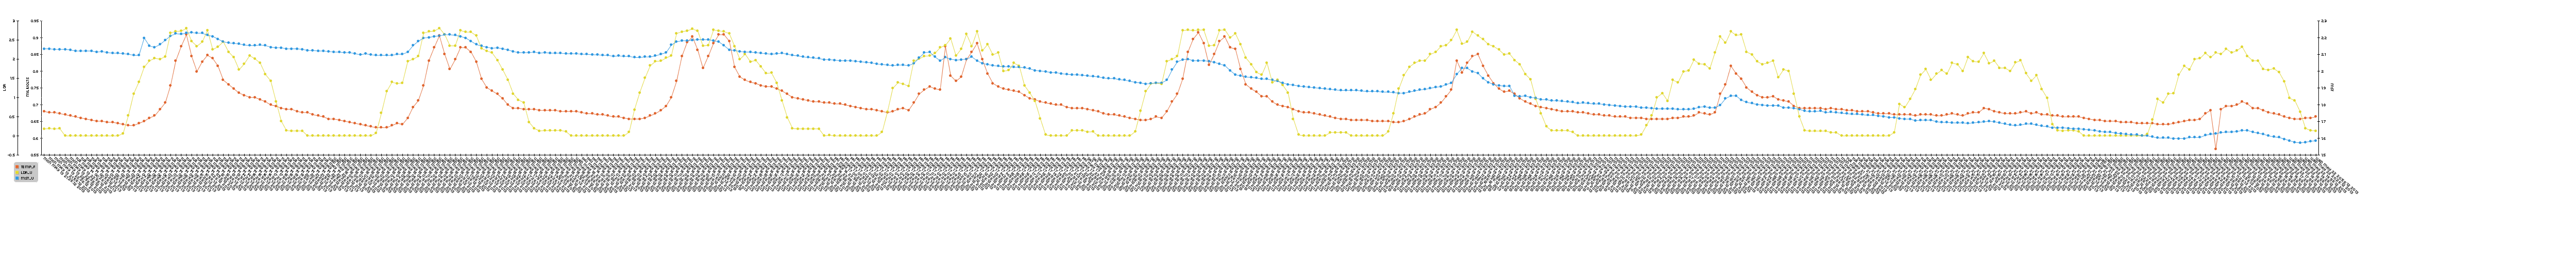
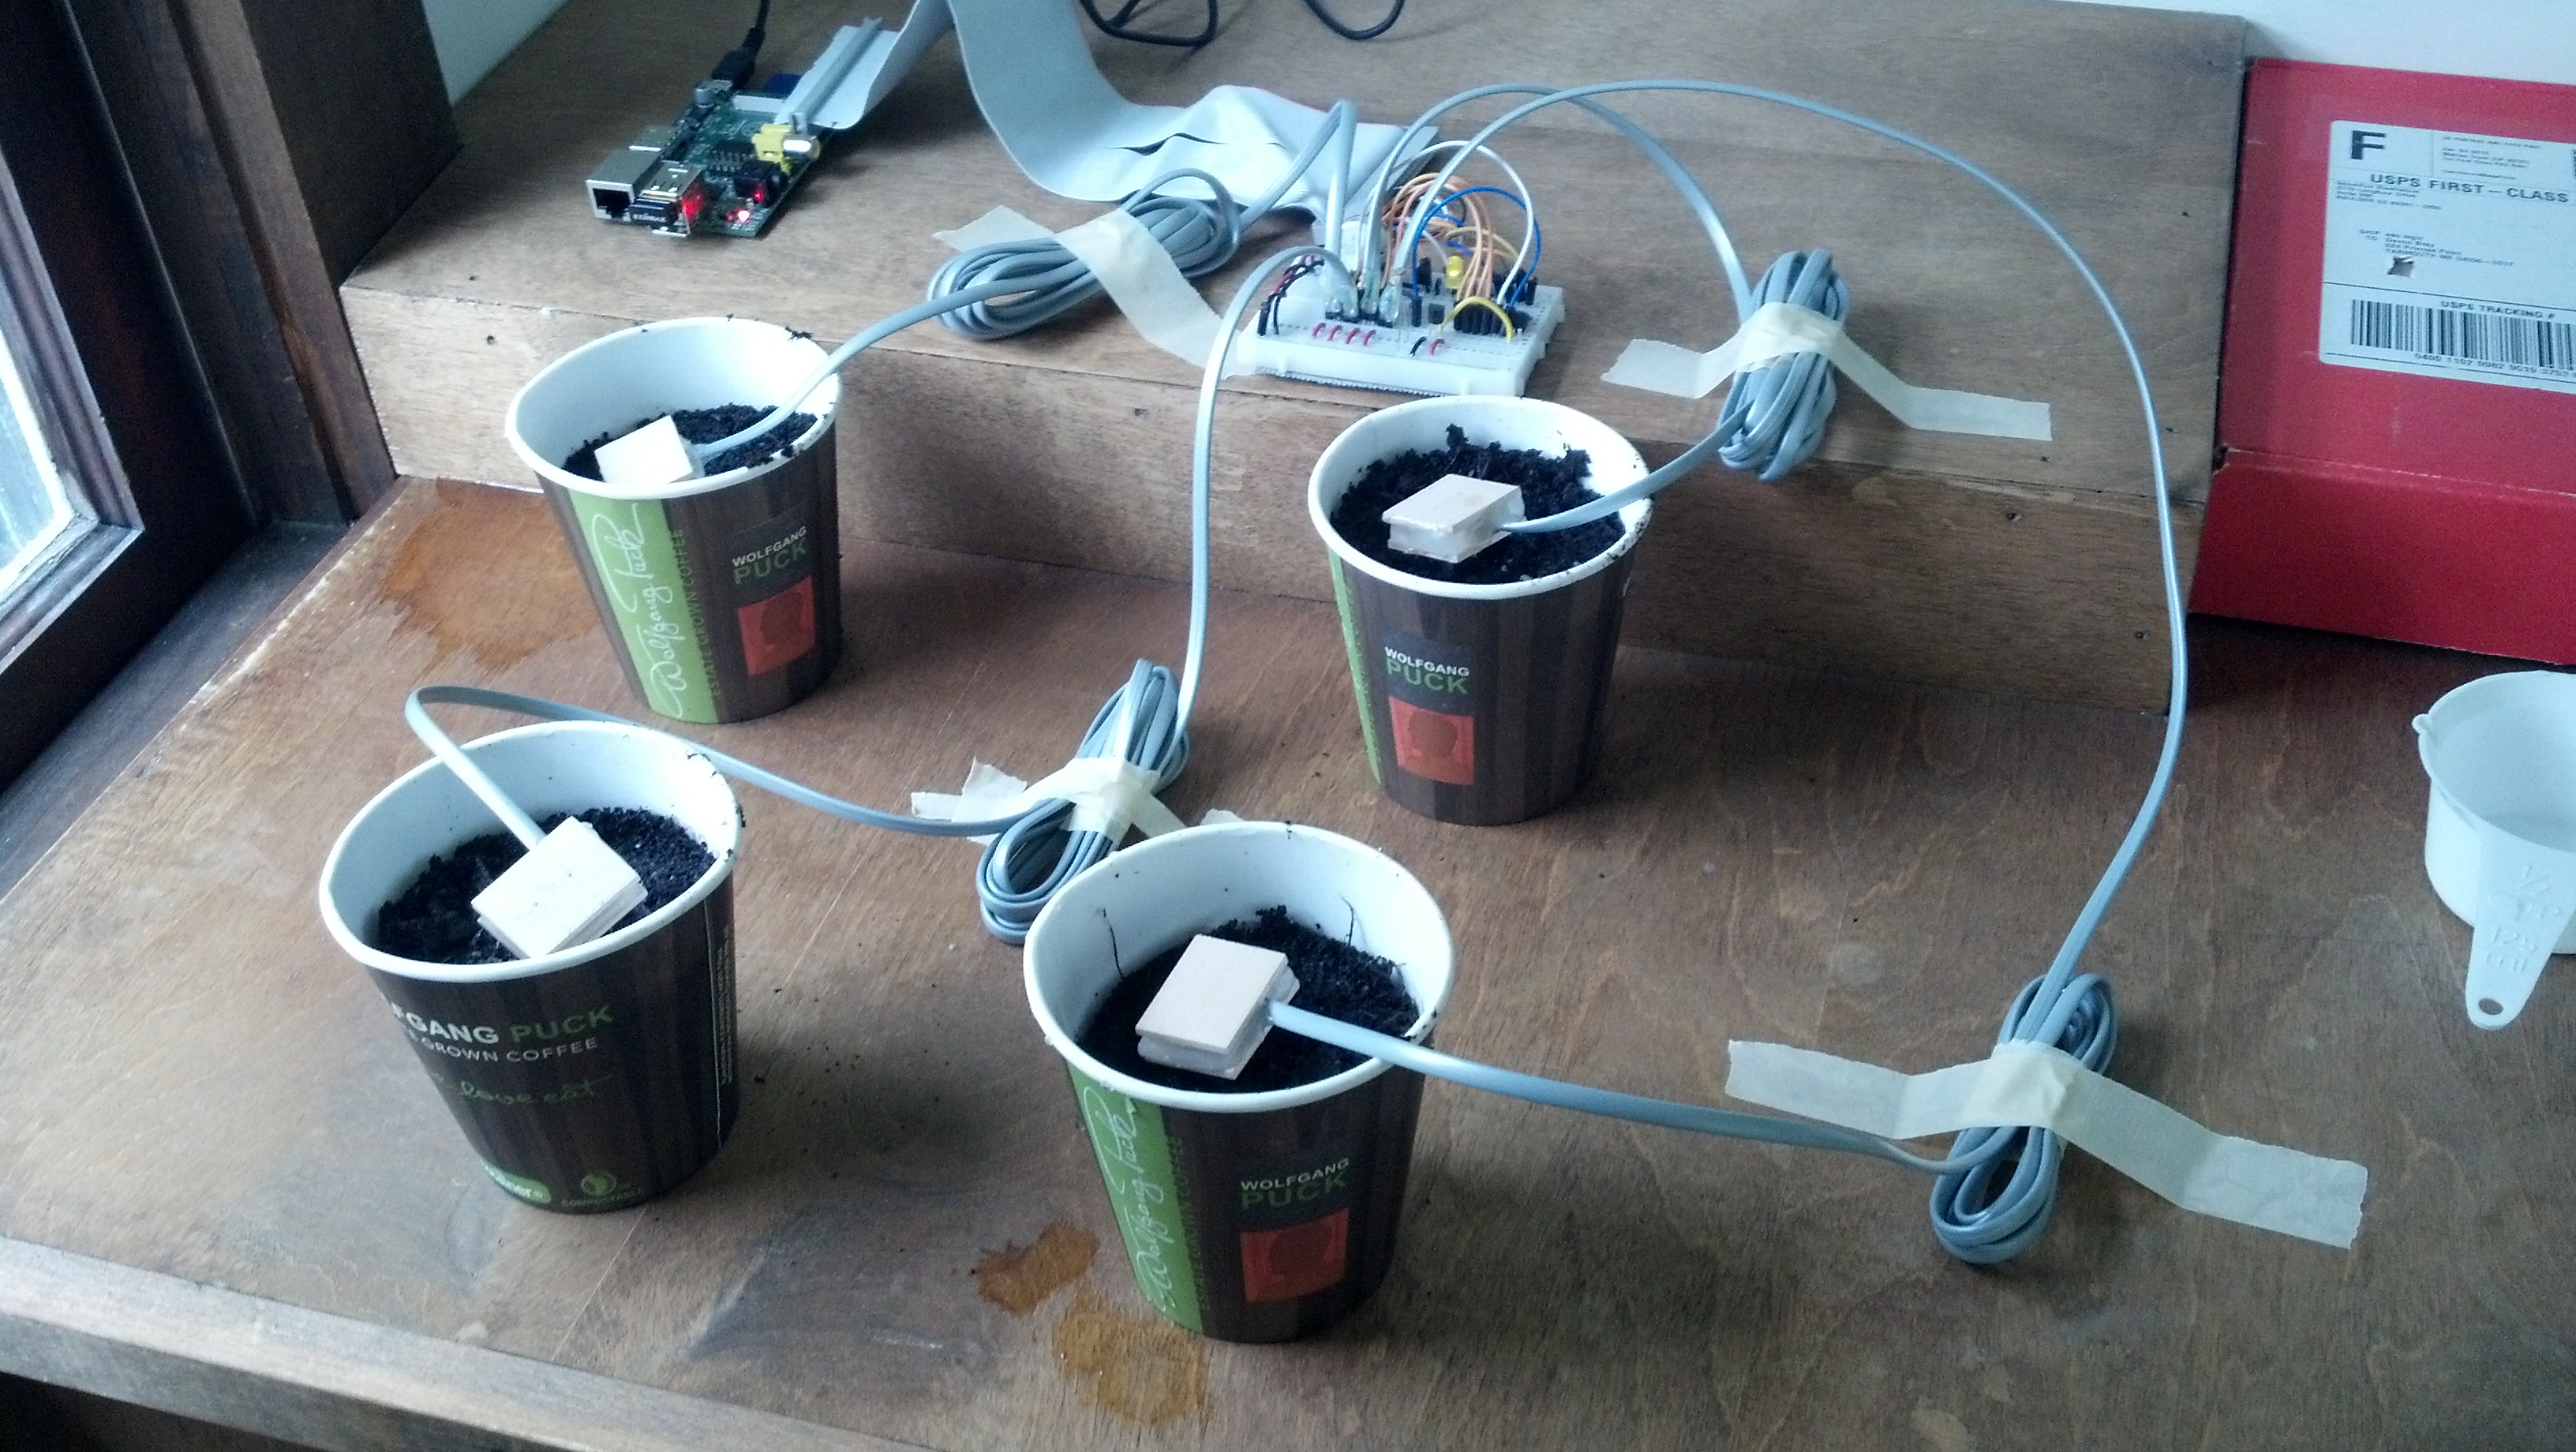
Essentially, every hour, the raspberry pi samples data from 4 humidity probes, an LDR and a tmp sensor. Once the sampling is complete, it dumps the data into a mysql database. From there the data is rendered into a graph using pChart in the form of a .png image. From there, that .png files is uploaded to flickr using this api. Once the file is uploaded, it returns it’s photo ID to the python script. From there, a tweet is built containing the brightness at the time of the tweet, the temperature at the time of the tweet, and the average moisture of the plants. It also uses the photo ID from flickr obtained earlier to build a URL leading to that image on flickr which it tweets as well. The final part of the tweet is a url that leads to this post!
That was a lot of explanation, but this program does quite a bit. The source comes in two parts, here’s the python script that handles the brunt of the processing. You will need a bunch of libraries to run this, you could pick through past posts of mine to find what those are, but when I do a final post for this project I will include all of those.
|
1 2 3 4 5 6 7 8 9 10 11 12 13 14 15 16 17 18 19 20 21 22 23 24 25 26 27 28 29 30 31 32 33 34 35 36 37 38 39 40 41 42 43 44 45 46 47 48 49 50 51 52 53 54 55 56 57 58 59 60 61 62 63 64 65 66 67 68 69 70 71 72 73 74 75 76 77 78 79 80 81 82 83 84 85 86 87 88 89 90 91 92 93 94 95 96 97 98 99 100 101 102 103 104 105 106 107 108 109 110 111 112 113 114 115 116 117 118 119 120 121 122 123 124 125 126 127 |
#Timing setup from datetime import datetime from apscheduler.scheduler import Scheduler import time import datetime import sys import os now =datetime.datetime.now() import logging #if you start getting logging errors, uncomment these two lines logging.basicConfig() #GPIO setup import RPi.GPIO as GPIO GPIO.setmode(GPIO.BOARD) GPIO.cleanup() pin = 26 #pin for the adc GPIO.setup(pin, GPIO.OUT) NPNtrans = 3 #the pin for the npn transistor GPIO.setup(NPNtrans, GPIO.OUT) sampleLED = 5 #the indicator LED GPIO.setup(sampleLED, GPIO.OUT) #the adc's SPI setup import spidev spi = spidev.SpiDev() spi.open(0, 0) #sets up the program's ability to write to a mysql database import MySQLdb con = MySQLdb.connect('localhost','piplanter_user','piplanter_pass','piplanter'); cursor = con.cursor() #tweepy setup, you must use the keys given to you when you create your app import tweepy consumer_key="" consumer_secret="" access_token="" access_token_secret="" #"logs in" to twitter, auth = tweepy.OAuthHandler(consumer_key, consumer_secret) auth.set_access_token(access_token, access_token_secret) api = tweepy.API(auth) import flickrapi #import xml.etree.ElementTree as ET api_key = '' api_secret = '' flickr = flickrapi.FlickrAPI(api_key, api_secret, format='json') (token, frob) = flickr.get_token_part_one(perms='write') if not token: raw_input("Press ENTER after you authorized this program") flickr.get_token_part_two((token, frob)) #fuction that can read the adc def readadc(adcnum): # read SPI data from MCP3008 chip, 8 possible adc's (0 thru 7) if adcnum > 7 or adcnum < 0: return -1 r = spi.xfer2([1, 8 + adcnum << 4, 0]) adcout = ((r[1] & 3) << 8) + r[2] return adcout def slowSample(): GPIO.output(NPNtrans, True) GPIO.output(sampleLED, True) sampleTime =time.ctime() mst1 = readadc(0) mst2 = readadc(1) mst3 = readadc(2) mst4 = readadc(3) pot1 = readadc(4) ldr1 = readadc(5) millivolts = readadc(6)*(3300.0/1024.0) temp_c = ((millivolts - 100.0)/10)-40.0 tmp1 = (temp_c * 9.0 / 5.0) + 32 #prints debug info to console print sampleTime,"|","MST1:",mst1,"MST2:",mst2,"MST3:",mst3,"MST4:",mst4,"Pot1:",pot1,"LDR1:",ldr1,"TMP1:",tmp1 #prints the debug info #adds the data to the mysql table cursor.execute("INSERT INTO piplanter_table_15(Time,mst1_V,mst2_V,mst3_V,mst4_V,pot1_V,ldr1_V,tmp1_F) VALUES(%s,%s,%s,%s,%s,%s,%s,%s)",(sampleTime,mst1,mst2,mst3,mst4,pot1,ldr1,tmp1)) con.commit() #this is important for live updating GPIO.output(NPNtrans, False) #turns the probes off #renders the image of the graph print "render start" os.system("php /opt/bitnami/apps/wordpress/htdocs/piplanter/renderScript.php") #renders the .png file print "render complete" #finds the newest image in the directory allfiles = sorted(os.listdir('/opt/bitnami/apps/wordpress/htdocs/piplanter/renders/'), key=lambda p: os.path.getctime(os.path.join('/opt/bitnami/apps/wordpress/htdocs/piplanter/renders/', p))) newest = '/opt/bitnami/apps/wordpress/htdocs/piplanter/renders/'+allfiles[-1] print 'File for upload: ' + newest #prints location and file to console response = flickr.upload(filename=newest, title=sampleTime, format='etree') #uploads the file to flickr photoID = response.find('photoid').text #gets the id of the photo for constructing a url print 'Upload Successful, Photo ID: ' + photoID #more debug info #tweets the image and data send = 'Brghtnss: ' + str(format((((float(ldr1)/1024)*100)),'.0f')) + '% / ' + 'Tmprtr: ' + str(format(tmp1,'.0f')) + ' Dg F' + ' / Avg Plnt Moisture: '+ str(format(float((float((mst1+mst2+mst3+mst4)/4)/1024)*100),'.0f')) + '%' + ' Graph: ' +'http://www.flickr.com/photos/97350286@N08/'+photoID +' - www.esologic.com/?p=643' #builds the text of the tweet print "Tweeting:" , send #for debug purposes api.update_status(send) #tweets the tweet time.sleep(.1) GPIO.output(sampleLED, False) slowSample() #runs the sample once before the interval starts, mostly a debug function scheduler = Scheduler(standalone=True) scheduler.add_interval_job(slowSample, hours=1) scheduler.start() #runs the program indefianately once every hour |
Here’s the .php script that renders the graph from the mysql data. It is called by the python script.
|
1 2 3 4 5 6 7 8 9 10 11 12 13 14 15 16 17 18 19 20 21 22 23 24 25 26 27 28 29 30 31 32 33 34 35 36 37 38 39 40 41 42 43 44 45 46 47 48 49 50 51 52 53 54 55 56 57 58 59 60 61 62 63 64 65 66 67 68 69 70 71 72 73 74 75 76 77 78 79 80 81 82 83 84 85 |
<?php /* Include all the classes */ include("/srv/www/lib/pChart/class/pData.class.php"); include("/srv/www/lib/pChart/class/pDraw.class.php"); include("/srv/www/lib/pChart/class/pImage.class.php"); $myData = new pData(); /* Create your dataset object */ $db = mysql_connect("localhost", "piplanter_user", "piplanter_pass"); //location of server, db username, db pass mysql_select_db("piplanter", $db); $Requete = "SELECT * FROM `piplanter_table_15`"; //table name $Result = mysql_query($Requete, $db); /*This fetches the data from the mysql database, and adds it to pchart as points*/ while($row = mysql_fetch_array($Result)) { $Time = $row["Time"]; $myData->addPoints($Time,"Time"); $mst1_V = $row["mst1_V"]; $myData->addPoints($mst1_V,"mst1_V"); $mst2_V = $row["mst2_V"]; $myData->addPoints($mst2_V,"mst2_V"); $mst3_V = $row["mst3_V"]; $myData->addPoints($mst3_V,"mst3_V"); $mst4_V = $row["mst4_V"]; $myData->addPoints($mst4_V,"mst4_V"); $ldr1_V = $row["ldr1_V"]; $myData->addPoints($ldr1_V,"ldr1_V"); $tmp1_F = $row["tmp1_F"]; $myData->addPoints($tmp1_F,"tmp1_F"); } $myData-> setSerieOnAxis("tmp1_F", 0); //assigns the data to the frist axis $myData-> setAxisName(0, "Degrees F"); //adds the label to the first axis $myData-> setSerieOnAxis("ldr1_V", 1); $myData-> setAxisName(1, "LDR"); $myData-> setSerieOnAxis("mst1_V", 2); $myData-> setSerieWeight("mst1_V",2); $myData-> setSerieOnAxis("mst2_V", 2); $myData-> setSerieOnAxis("mst3_V", 2); $myData-> setSerieOnAxis("mst4_V", 2); $myData-> setAxisName(2, "Relative Moisture"); $myData->setAbscissa("Time"); //sets the time data set as the x axis label $myData-> setSerieWeight("mst1_V",1); //draws the line tickness $myData->setPalette("mst1_V",array("R"=>58,"G"=>95,"B"=>205,"Alpha"=>80)); //sets the line color $myData-> setSerieWeight("mst2_V",1); $myData->setPalette("mst2_V",array("R"=>39,"G"=>64,"B"=>139,"Alpha"=>80)); $myData-> setSerieWeight("mst3_V",1); $myData->setPalette("mst3_V",array("R"=>0,"G"=>34,"B"=>102,"Alpha"=>80)); $myData-> setSerieWeight("mst4_V",1); $myData->setPalette("mst4_V",array("R"=>67,"G"=>110,"B"=>238,"Alpha"=>80)); $myData-> setSerieWeight("ldr1_V",2); $myData-> setSerieTicks("ldr1_V", 4); $myData-> setSerieWeight("tmp1_F",2); $myData-> setSerieTicks("tmp1_F", 4); $myPicture = new pImage(2000,500,$myData); /* Create a pChart object and associate your dataset */ $myPicture->setFontProperties(array("FontName"=>"/srv/www/lib/pChart/fonts/pf_arma_five.ttf","FontSize"=>6)); /* Choose a nice font */ $myPicture->setGraphArea(130,40,1900,300); /* Define the boundaries of the graph area */ $myPicture->drawScale(array("LabelRotation"=>320)); /* Draw the scale, keep everything automatic */ $Settings = array("R"=>250, "G"=>250, "B"=>250, "Dash"=>1, "DashR"=>0, "DashG"=>0, "DashB"=>0); /*The combination makes a cool looking graph*/ $myPicture->drawPlotChart(); $myPicture->drawLineChart(); $myPicture->drawLegend(30,320); //adds the legend //$date-> date("d-M-Y:H:i:s"); //$myPicture->autoOutput(); /* Build the PNG file and send it to the web browser */ $myPicture->render("/opt/bitnami/apps/wordpress/htdocs/piplanter/renders/".date("d-M-Y_H:i:s").".png"); ?> |
Thanks for reading!