This is a reflection and look into the design thinking behind this project, if you want skip to the software, CAD or schematics, check out start-here.
Overview
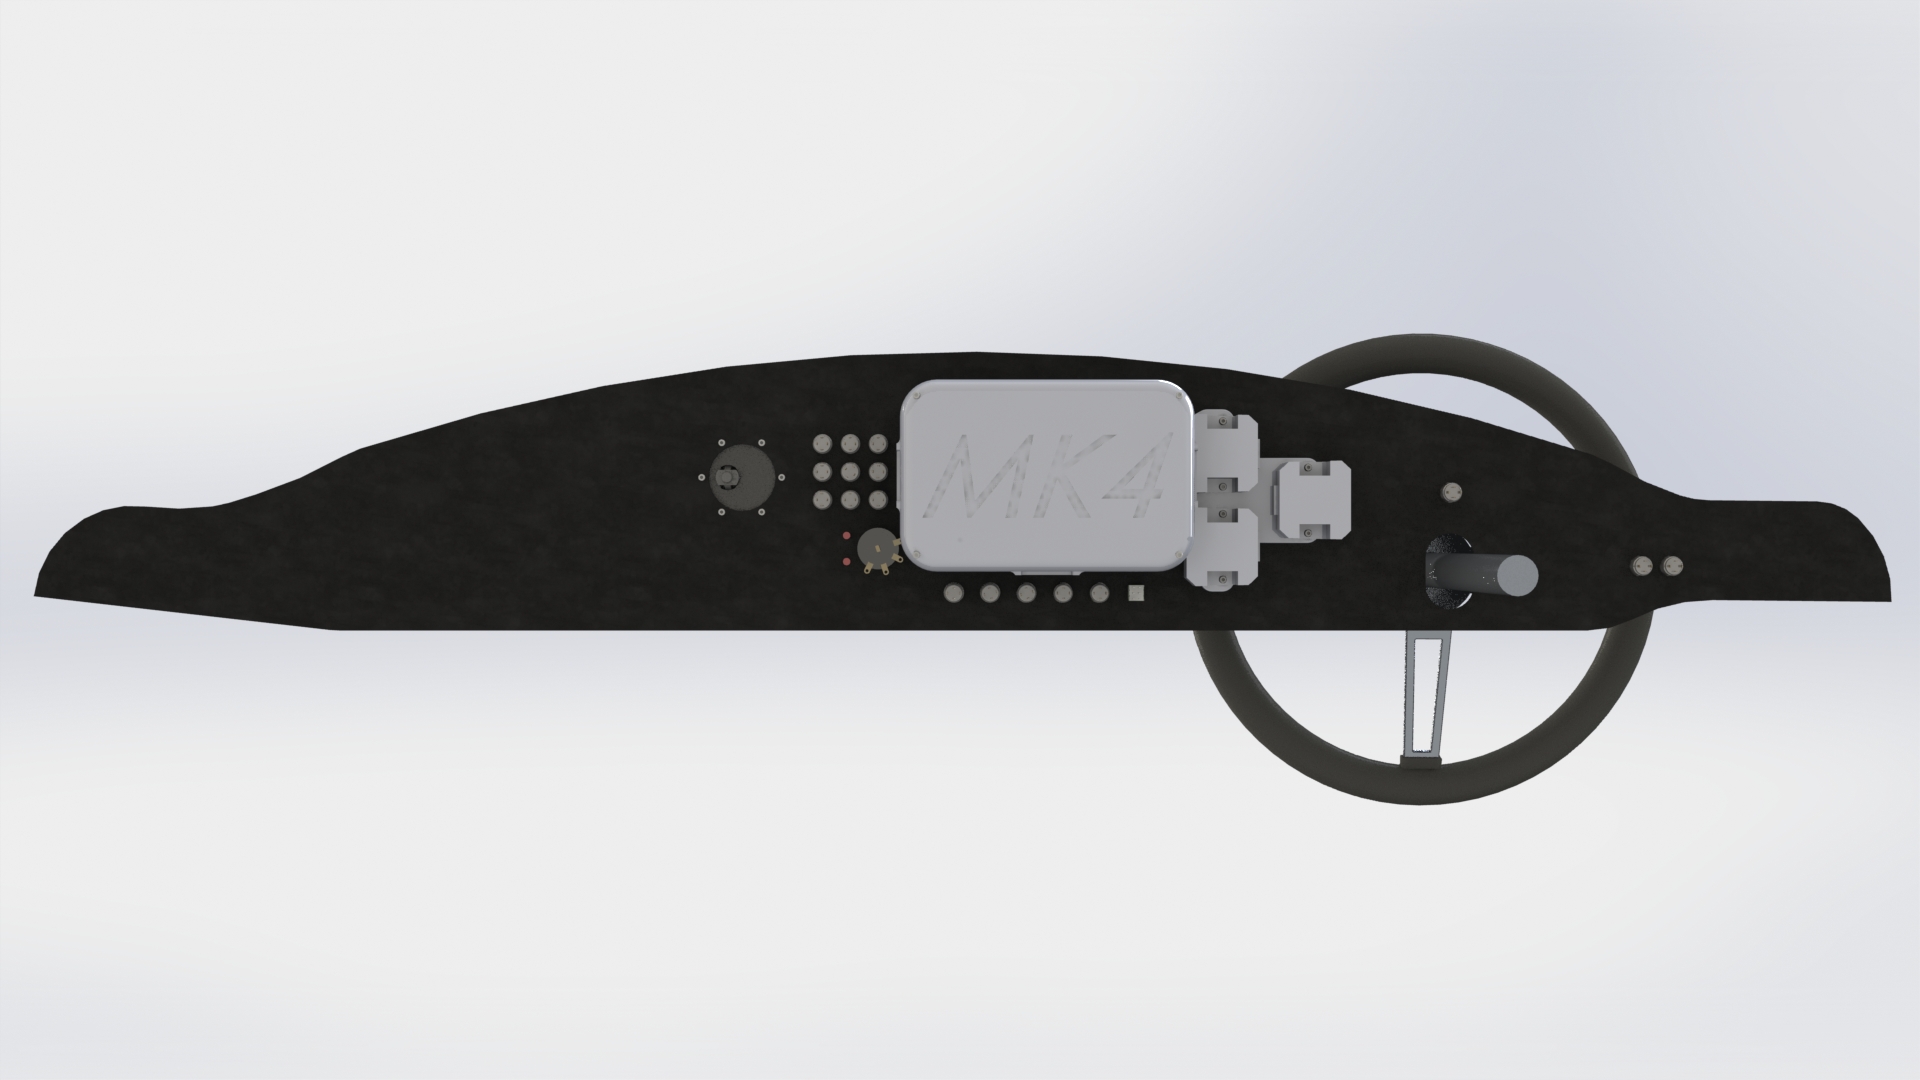
This project is a fully customizable, open-source, digital dashboard for a replica 1965 Ford Shelby Cobra, the Factory 5 MK4 Roadster. It is a fusion of the classic styling of the Cobra, with the convince and features that come with modern digital dashboards.
The goal was to serve as the basis for further work into automotive IoT. The GUI displays much more accurate and comprehensive information than a normal car dashboard, and things like logging and event triggering can be easily built right in.
This work should serve as a primer for those who want to get into taking DIY automotive to the next level. This car was not equipped with a CAN bus so all control had to be implemented bare-metal.
This has been the most comprehensive project I have ever completed. Each part, mechanical, electrical, firmware, and software was harder than the last, and each of them pushed my knowledge to it’s limits. All of the work described in this blog post, and all of the work put on my github was completed entirely by myself.
Coolest Features
- Fully customizable dashboard gauges layout. The display is driven by a Raspberry Pi 3 running electron, so you tuning the layout is as simple as a CSS style sheet.
- Keypad locking and unlocking. Enter your secret pin and you can operate the car.
Push to start. Using oil pressure & tachometer. - Integrated backup camera. Shown over the UI when the car is put into reverse.
- Day/Night driving modes. Using an embedded light dependent resistor, the dashboard gauges automatically change color depending on ambient light level for maximum visibility.
- Integrated cruise control. Using the Rostra Ultracruise module.
- Micro-amp draw in the off state. All of the electronics draw virtually nothing from the battery when off.
- Integrated phone mount and charger. For using GPS etc. Charger can do up to a 3A charge.
Let’s go through the project by each of it’s design areas.
Mechanical Design
The first major design area to focus on is the Mechanical Design. The following images are renders from Solidworks and then photos from real life:
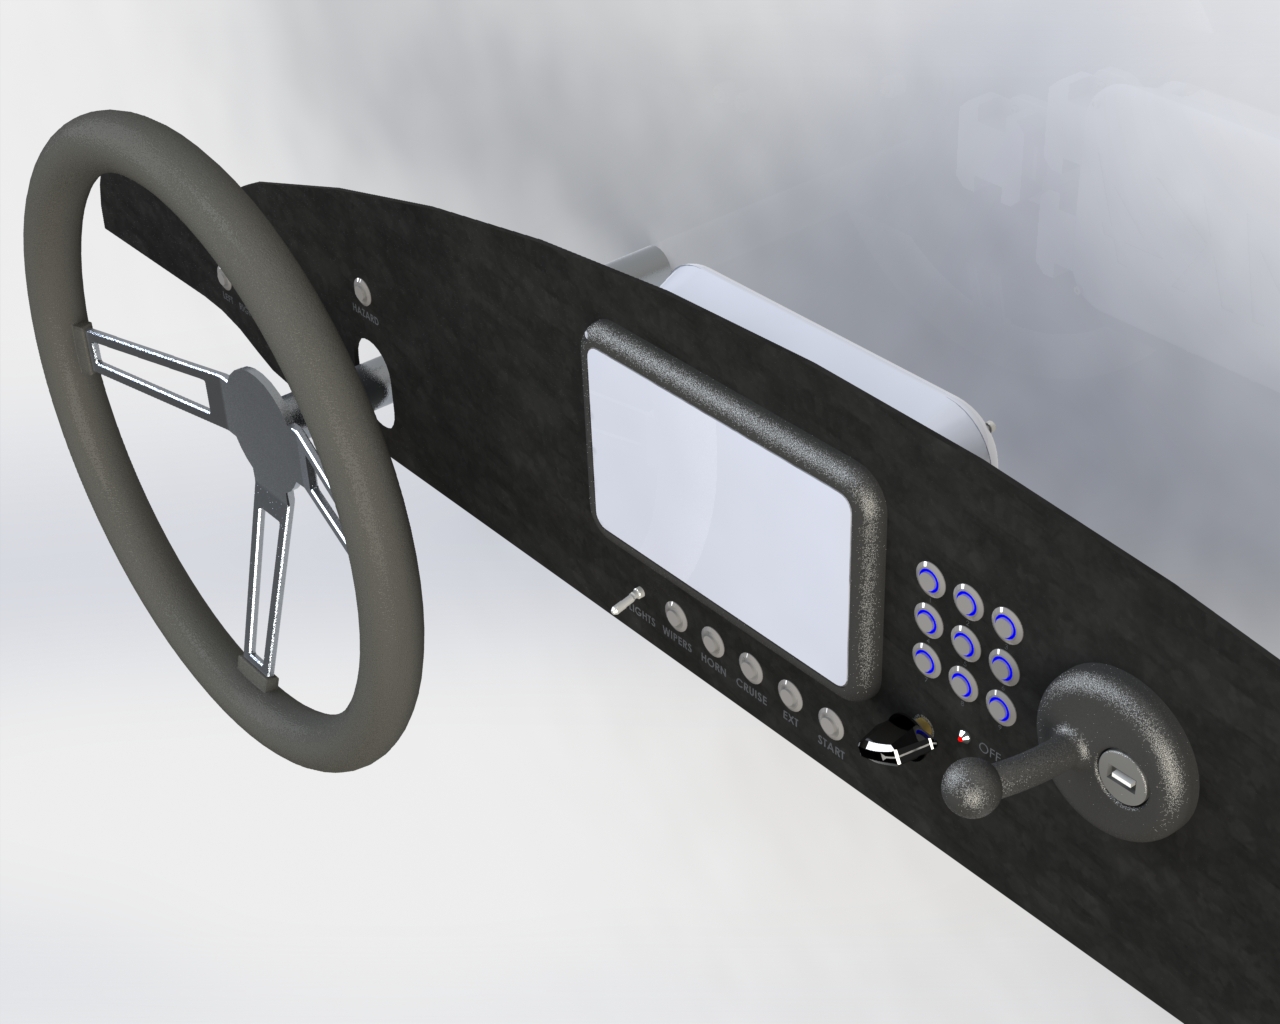
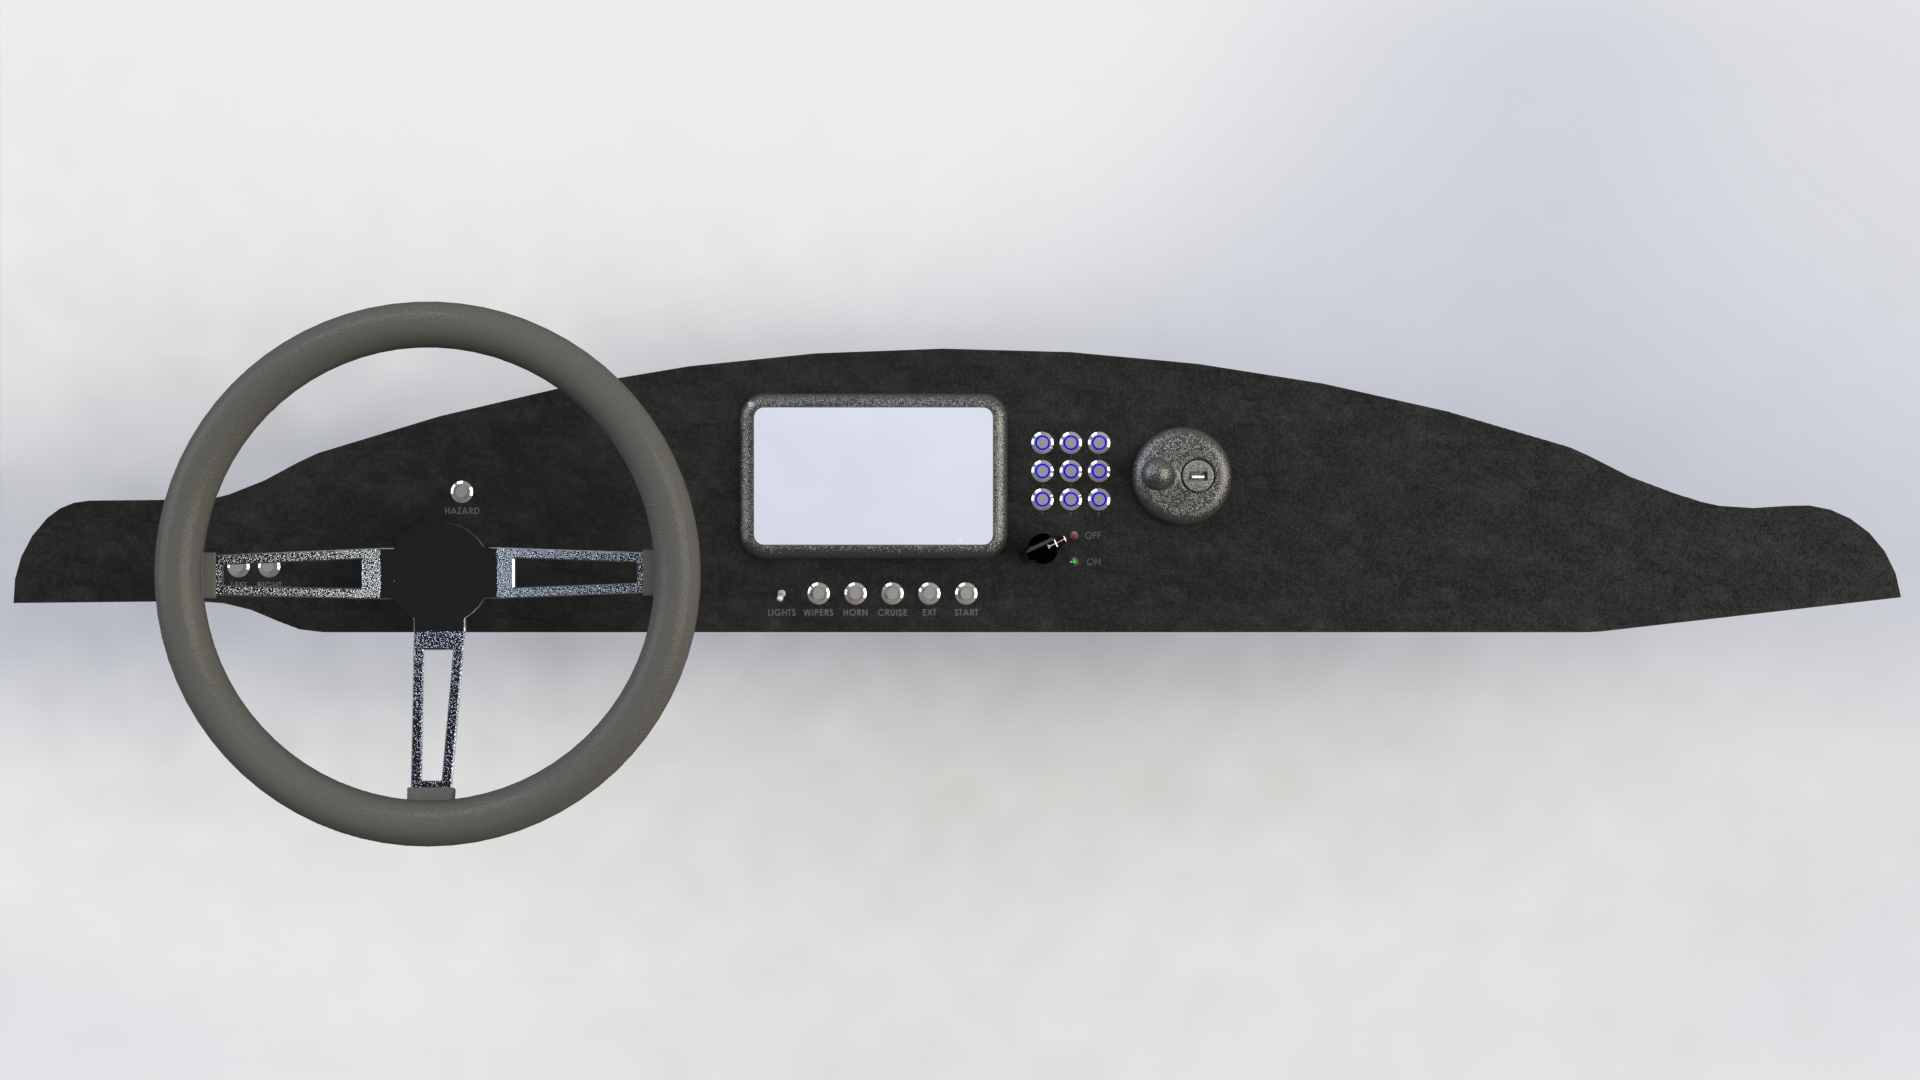

Parts were modeled in Solidworks and manufactured mostly using 3D printing. The actual dashboard pieces laser cut from either 1/4″ walnut or 1/8″ anodized aluminium. All of the 3D printed parts were printed on a Prusa i3 MK2 FDM printer using PolyMide CoPA from Polymaker. This material was selected due to it’s strength and resistance to high heat.
It was very difficult to get the hang of printing the large, flat parts for this project using a material prone to warping. Mastering that material was a project in it’s own right which I might write a guide on if asked.
One part, the display oring, was printed using Ninjaflex.
The wood-based dashboard was created as a backup in-case the aluminium one didn’t work out. The aluminum was very expensive and wood was used as a cheaper option in case of failure.
Considerations also had to be made that all of the electronics and wiring would be secured into place. The Electrical Design section of this post covers how that was done.
Electrical Design
The PCB design and electrical wiring was the most complicated part of this project. There are 24 input/output signals from the car that are driven (mostly) through power MOSFET devices. There are 21 hardware UI elements that the user interacts with the car through.
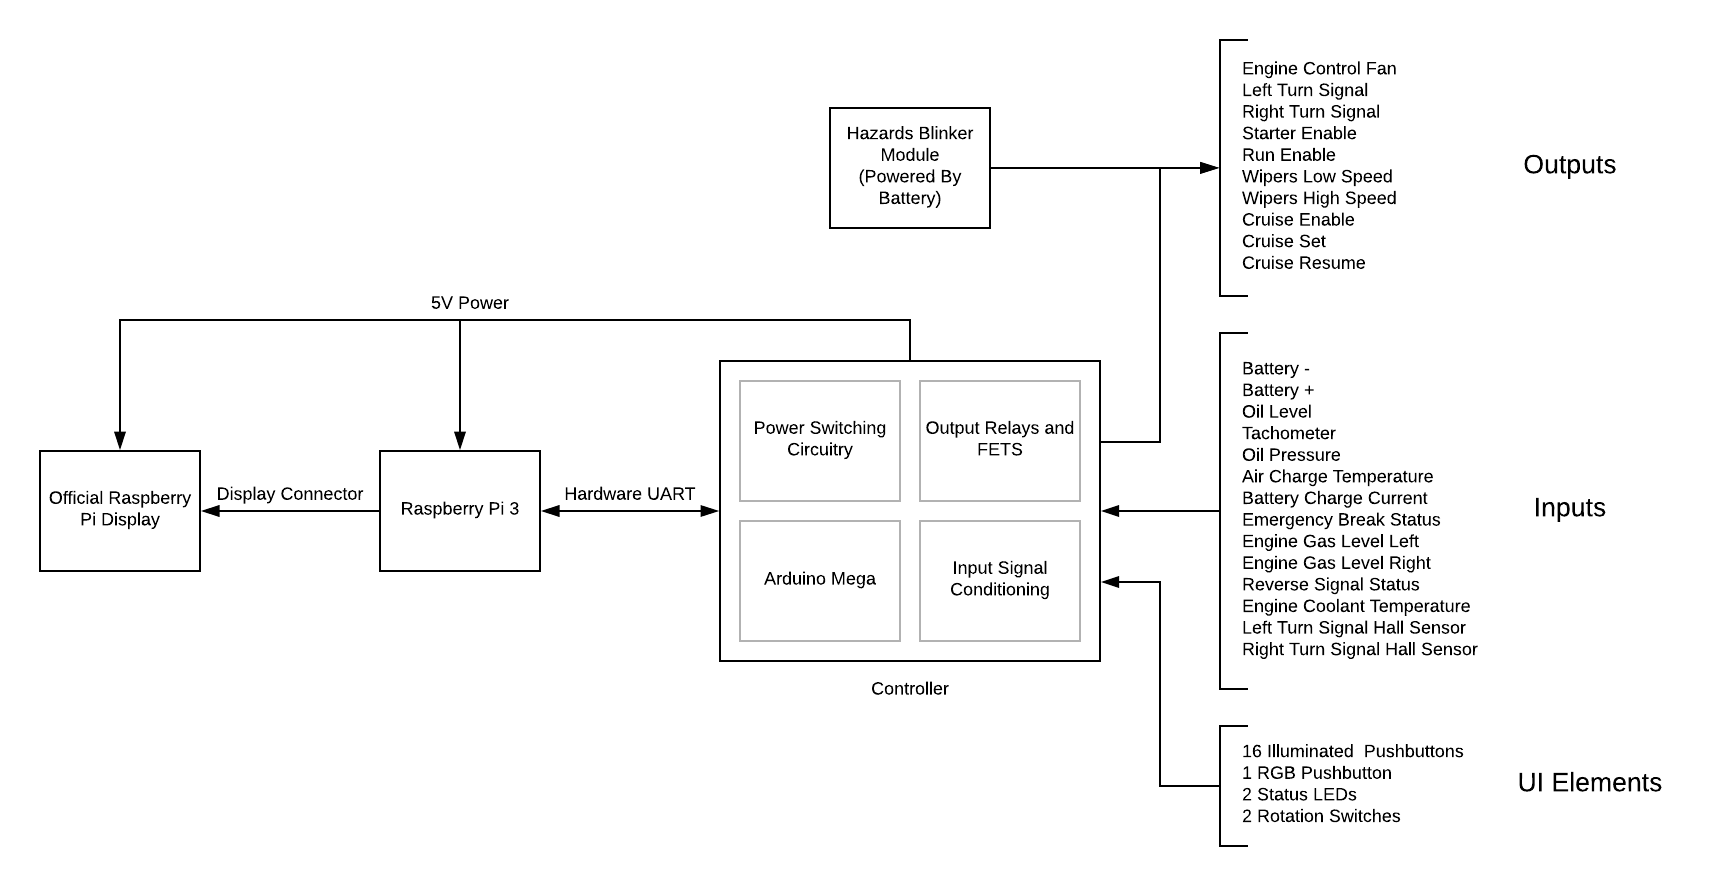
There are also 3 high-current 12V -> 5V power converters. In the early stages of this project we tried to get away with using board mounted solutions but they couldn’t handle the max current draw of the Pi and it’s display as well as the phone charger so we switched to driving dedicated modules using PMOS devices. These are the large grey boxes to the right of the PCB mount in the images below.
This volume of signals resulted in a fairly large PCB that was mostly just a ton of connectors:

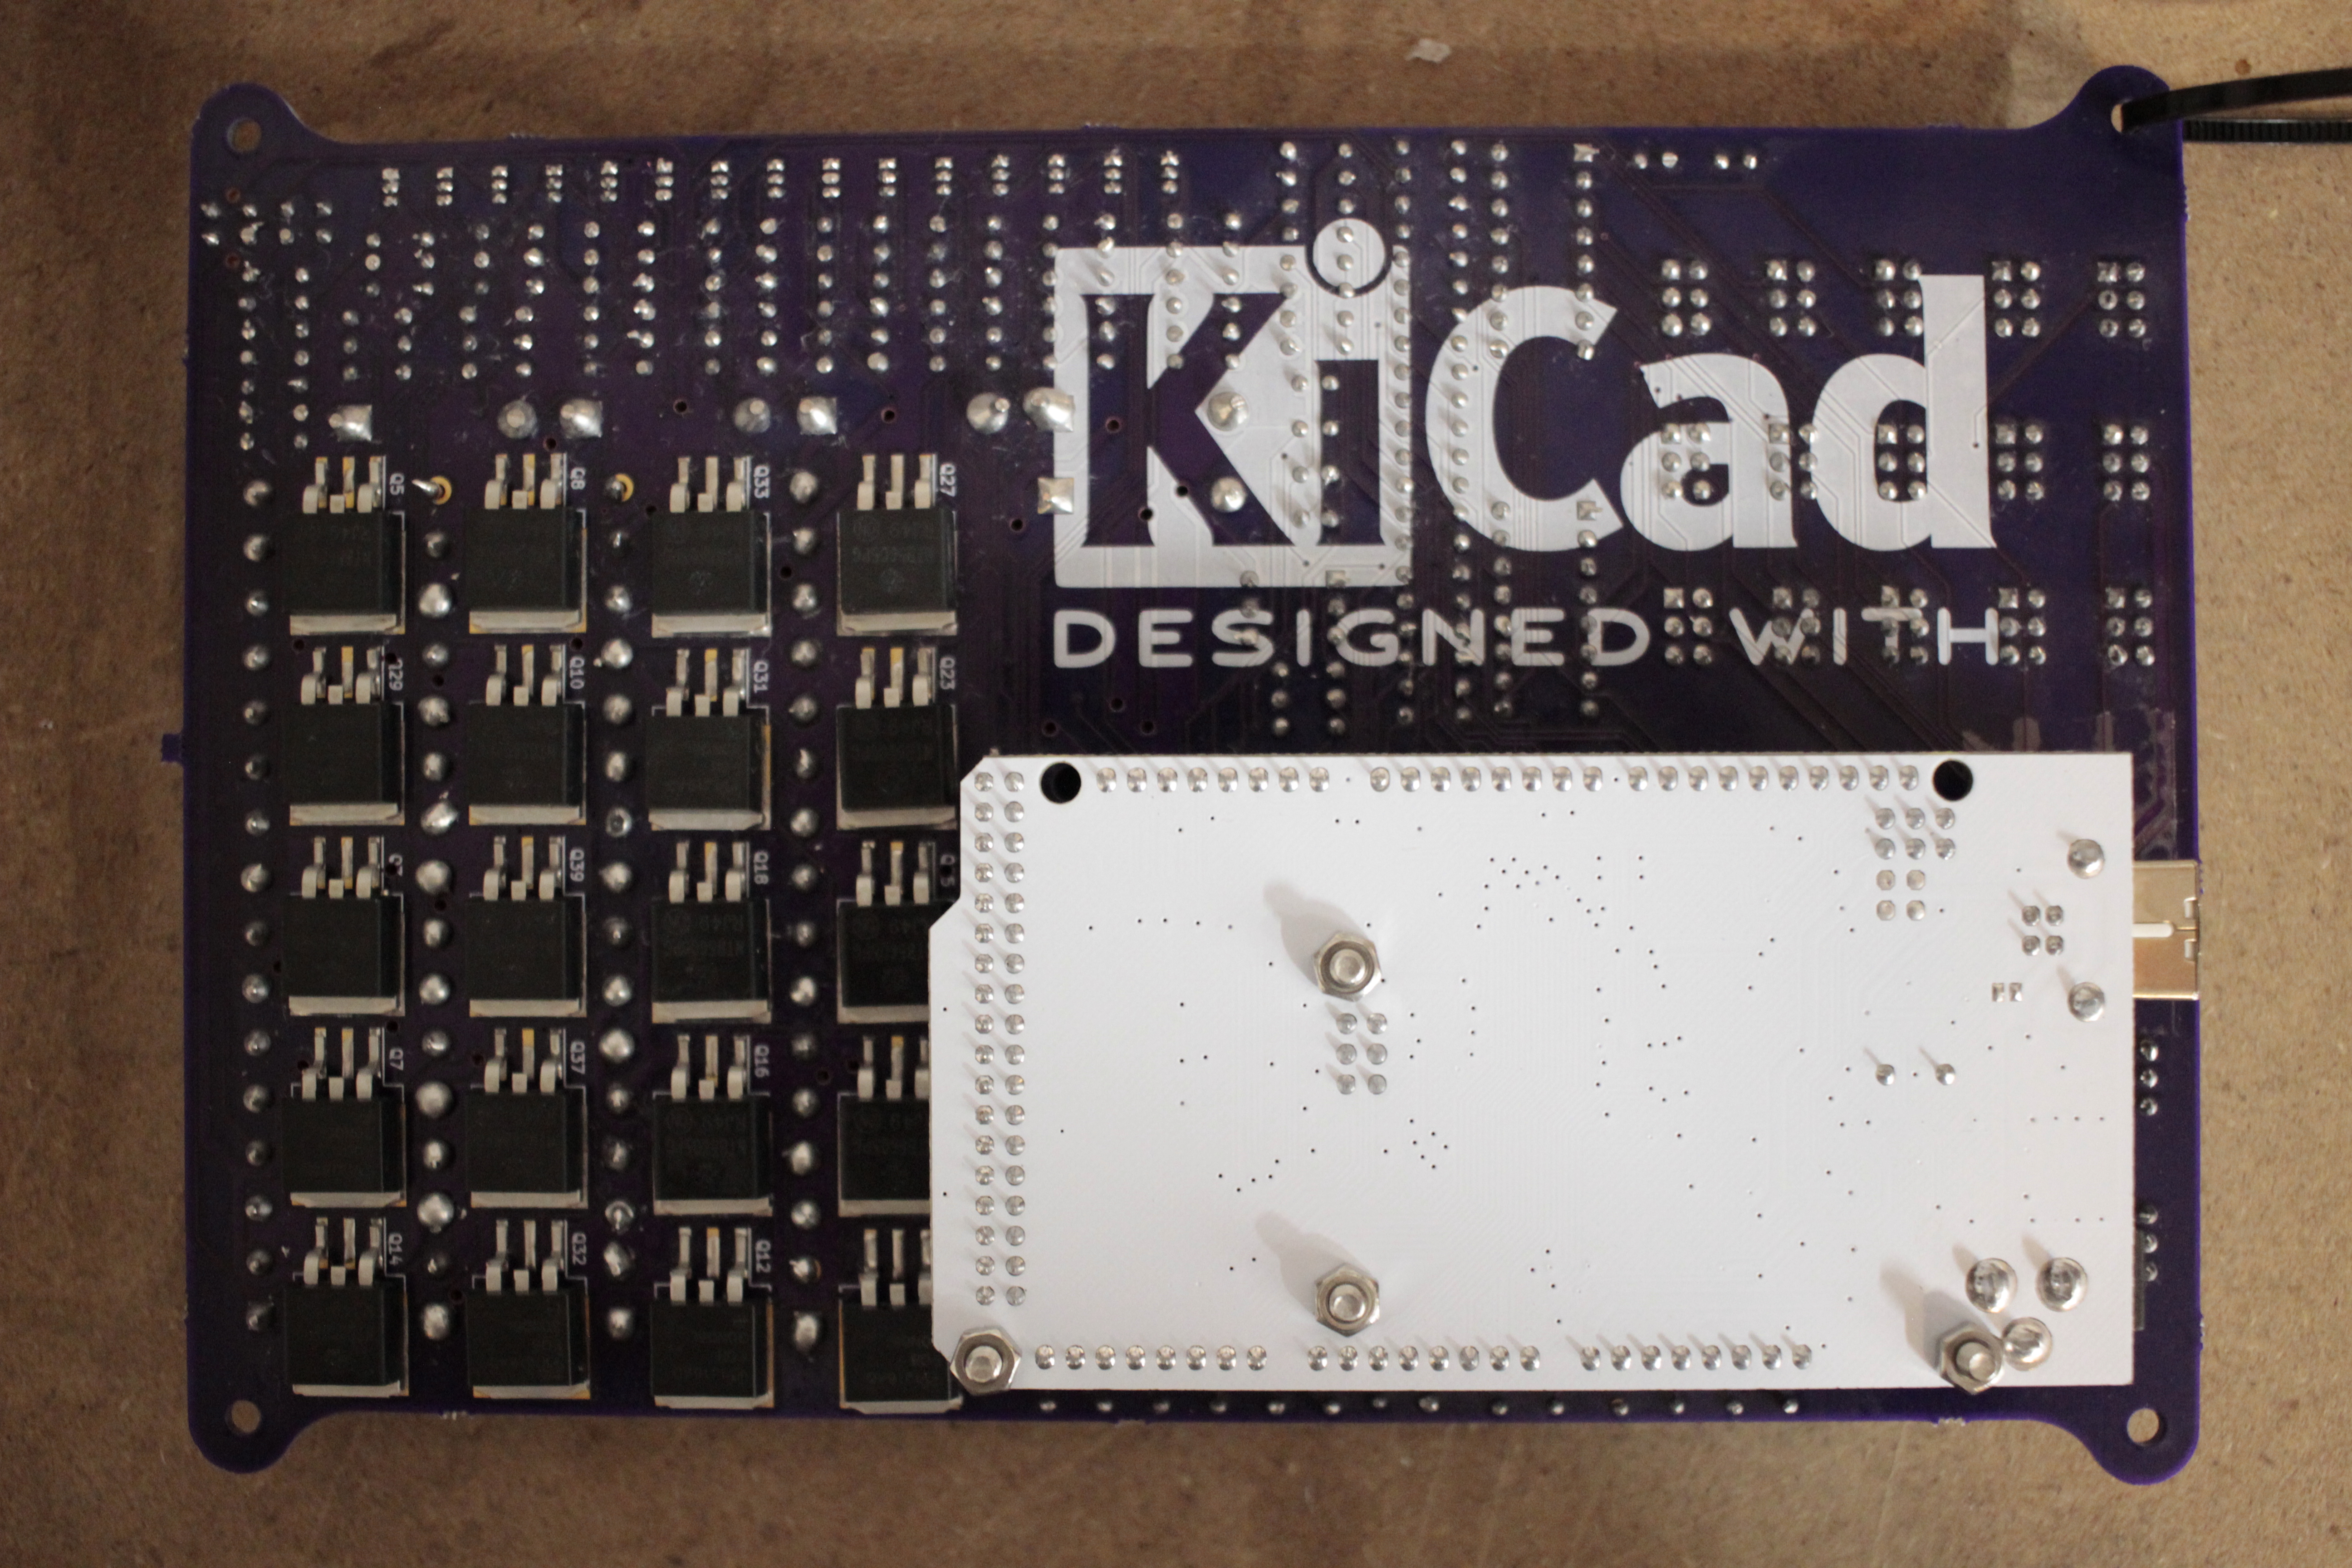
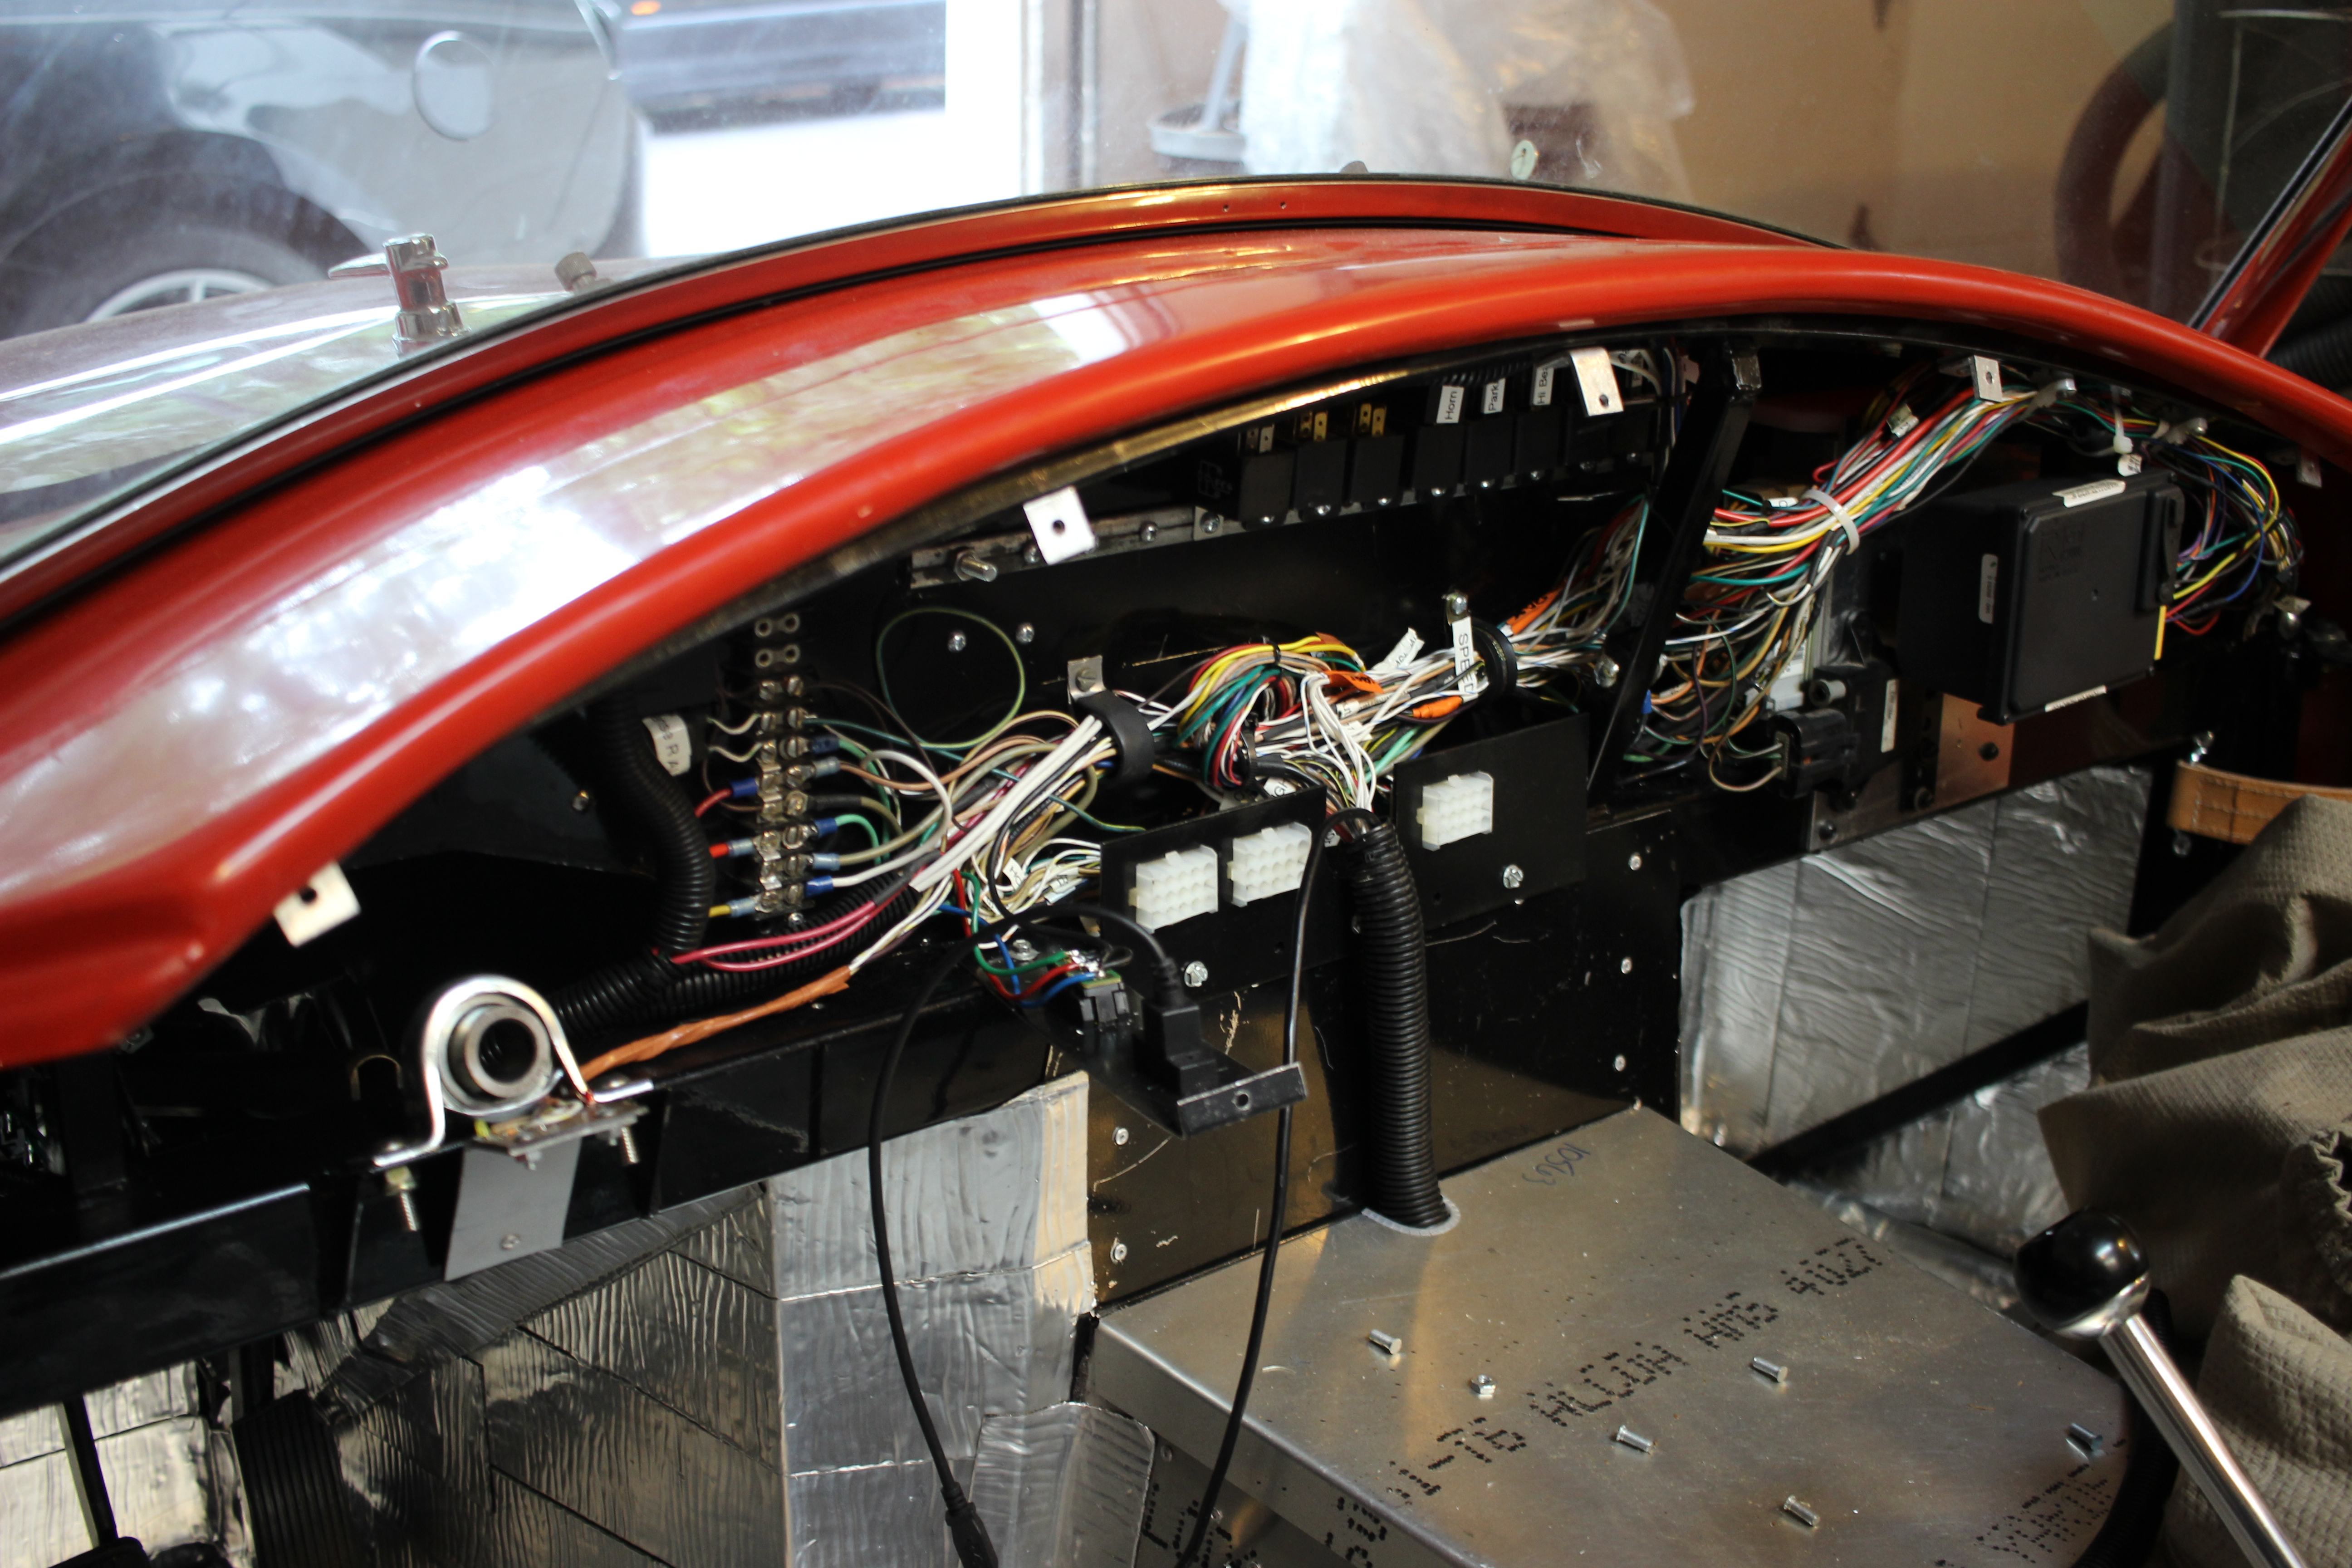
All of that wire is secured into place by a large clamp that comes over the top of the PCB. This first picture shows the top of the PCB with just the hardware UI buttons and switches installed: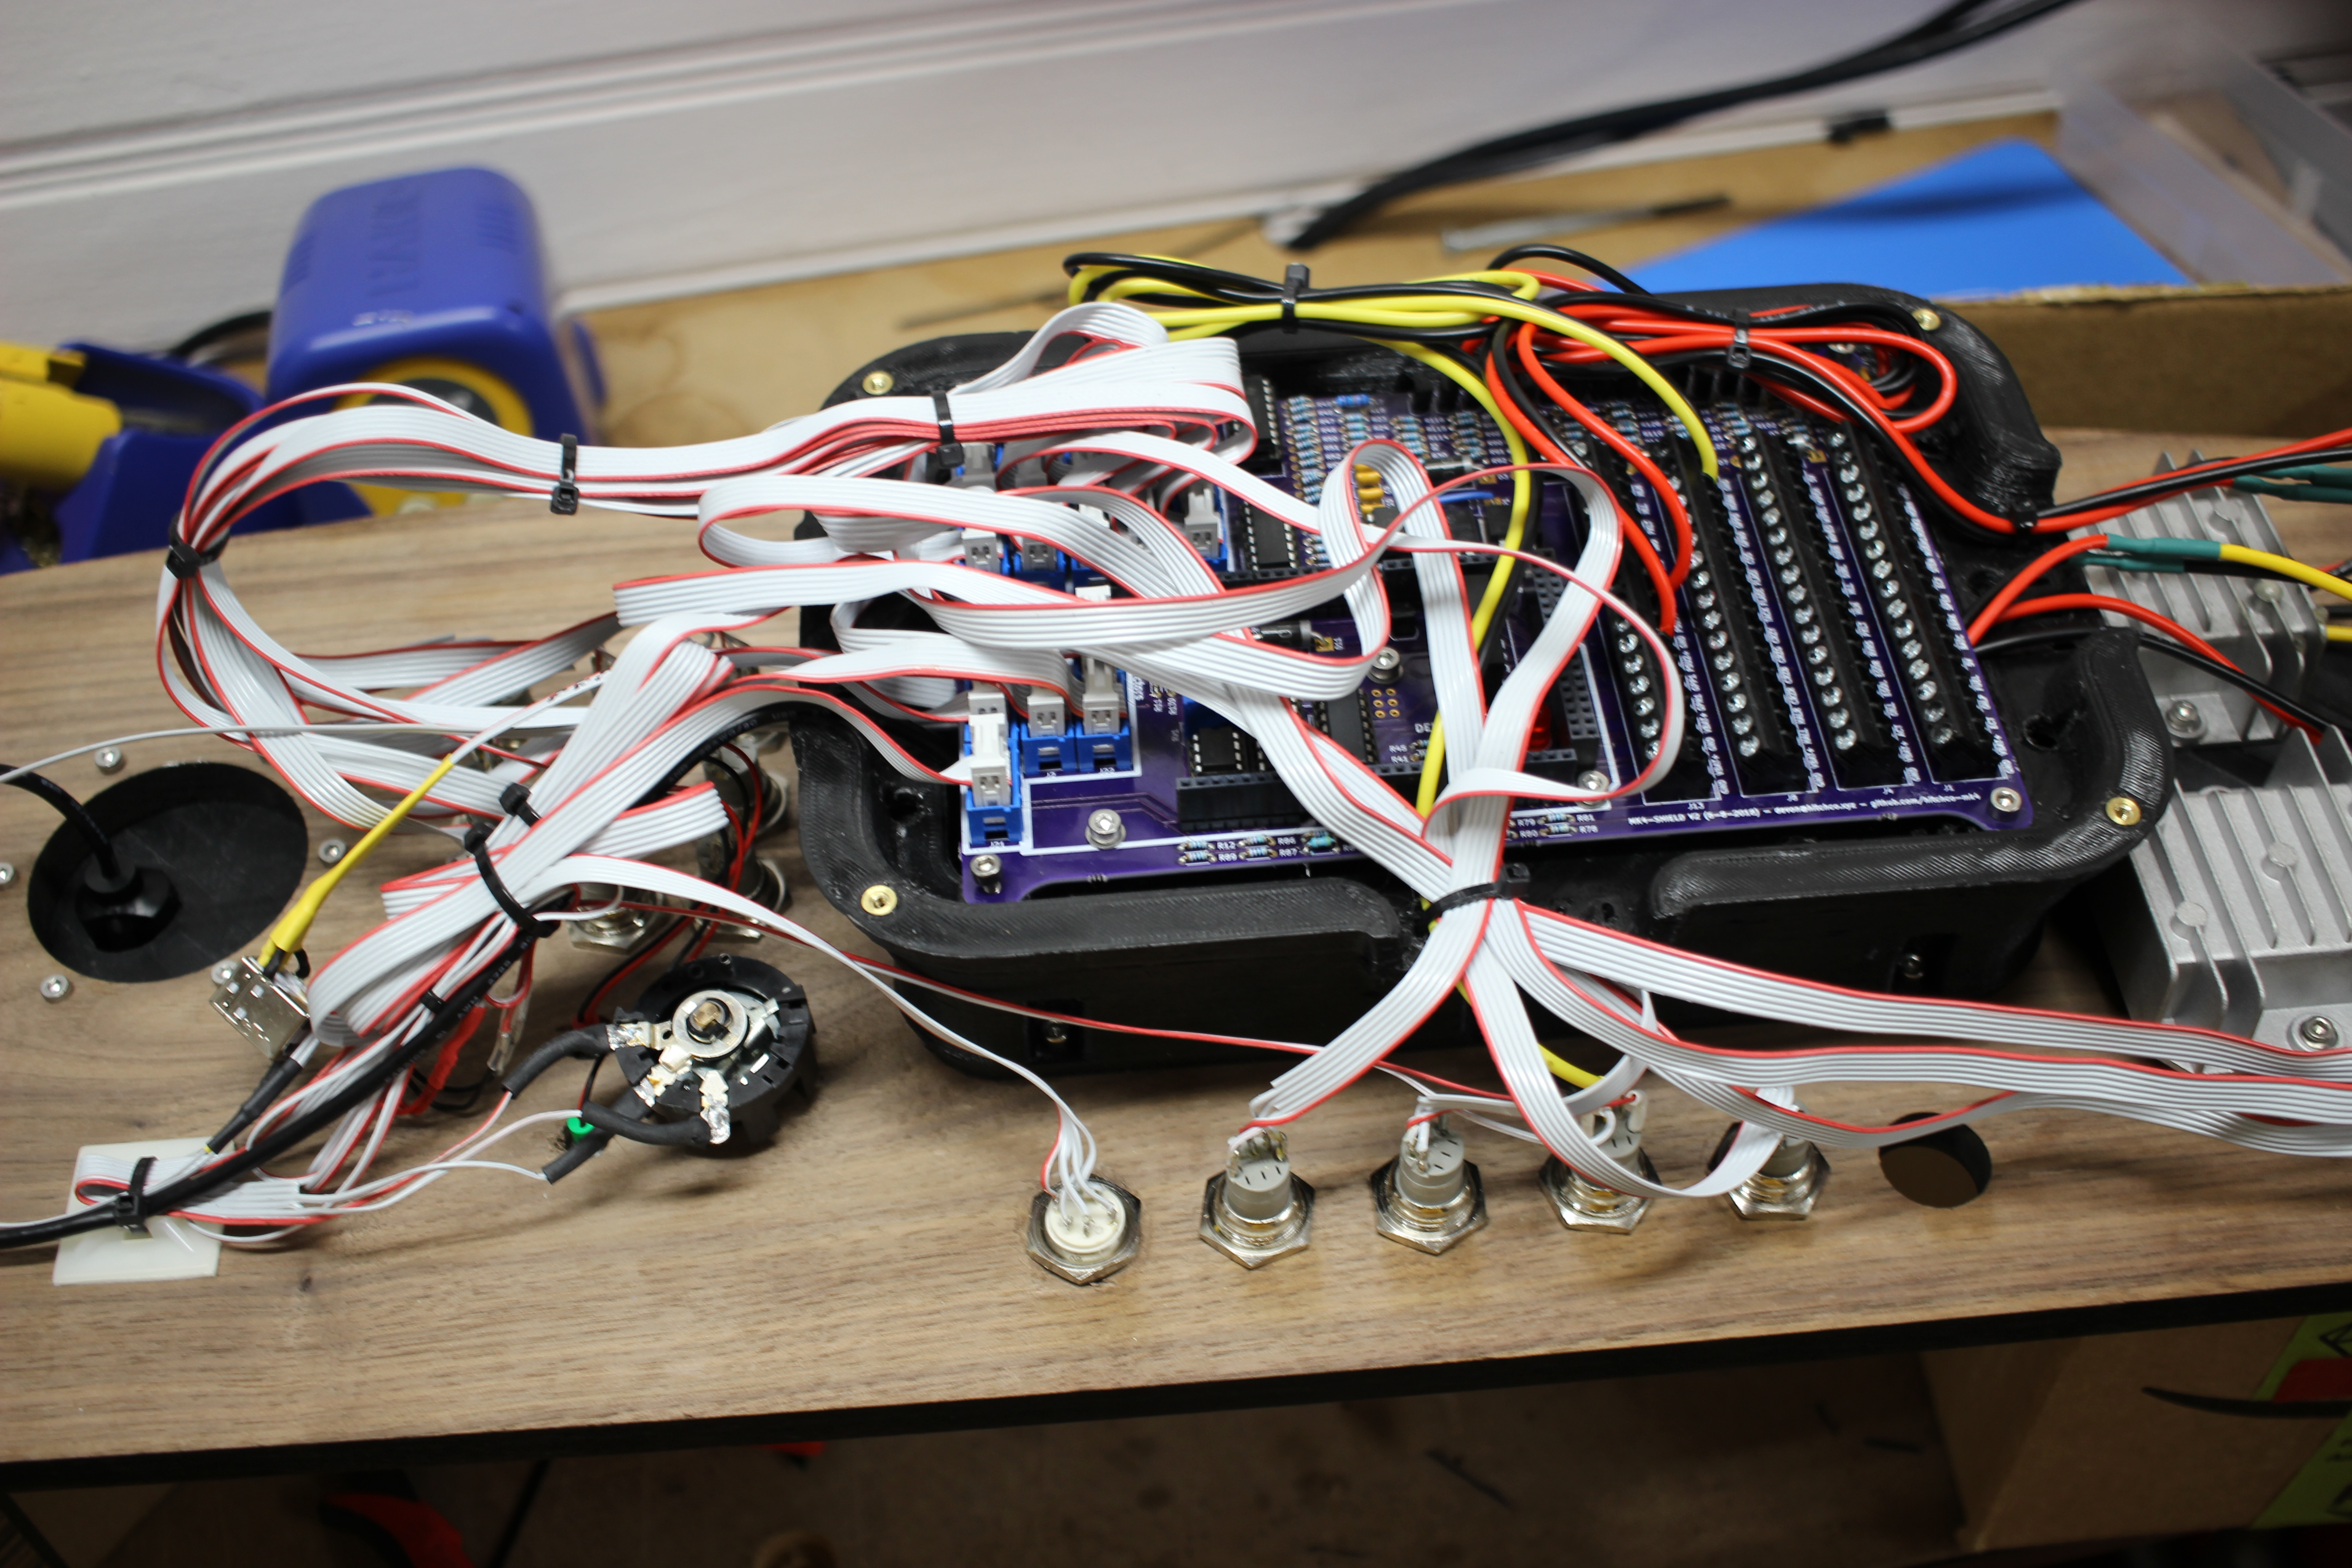
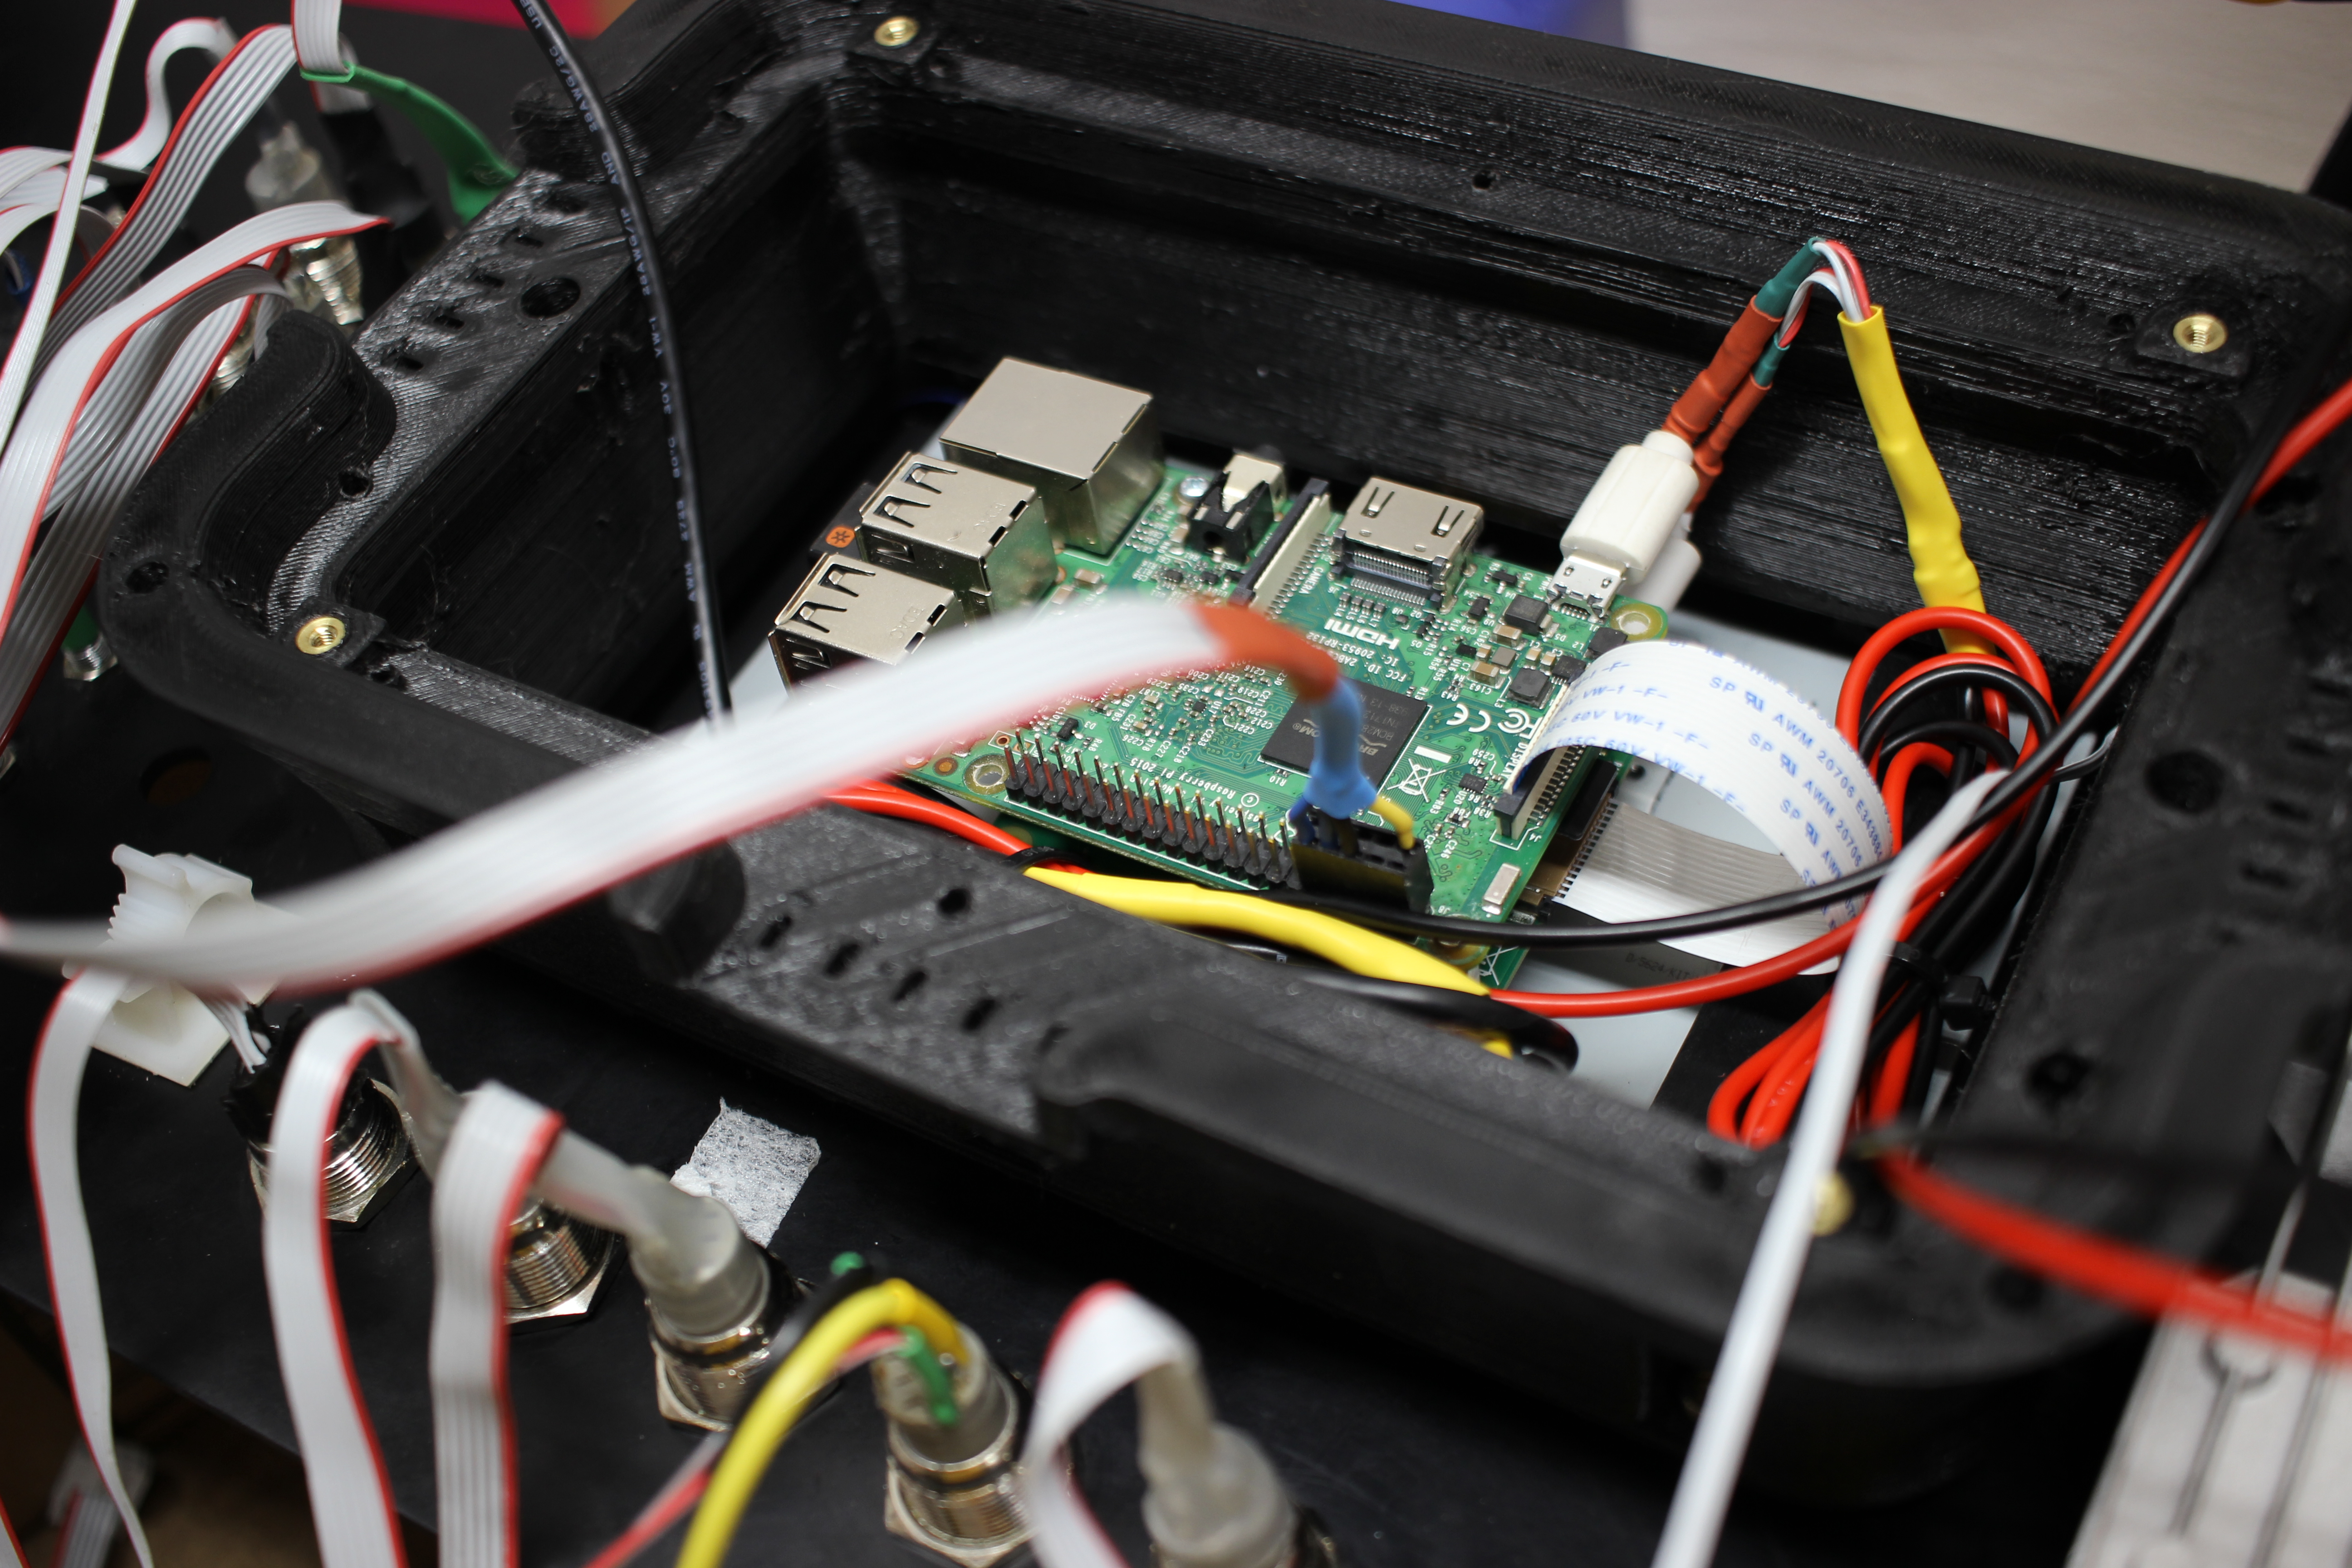
The Pi sits just below the PCB, and is connected to the arduino via a ribbon cable that carries serial communication. The Pi and official Raspberry Pi display must be powered via the USB ports, and the other end of that wire is connected to one of the high current DC/DC converters mentioned earlier.
Once the signals leave the PCB via the screw terminals, they are plugged inserted into one of 3 15 pin Molex terminal blocks. The mating connector is mounted inside of the car. Here are a few shots of the PCB with the cable clamp installed: Looks much cleaner right?
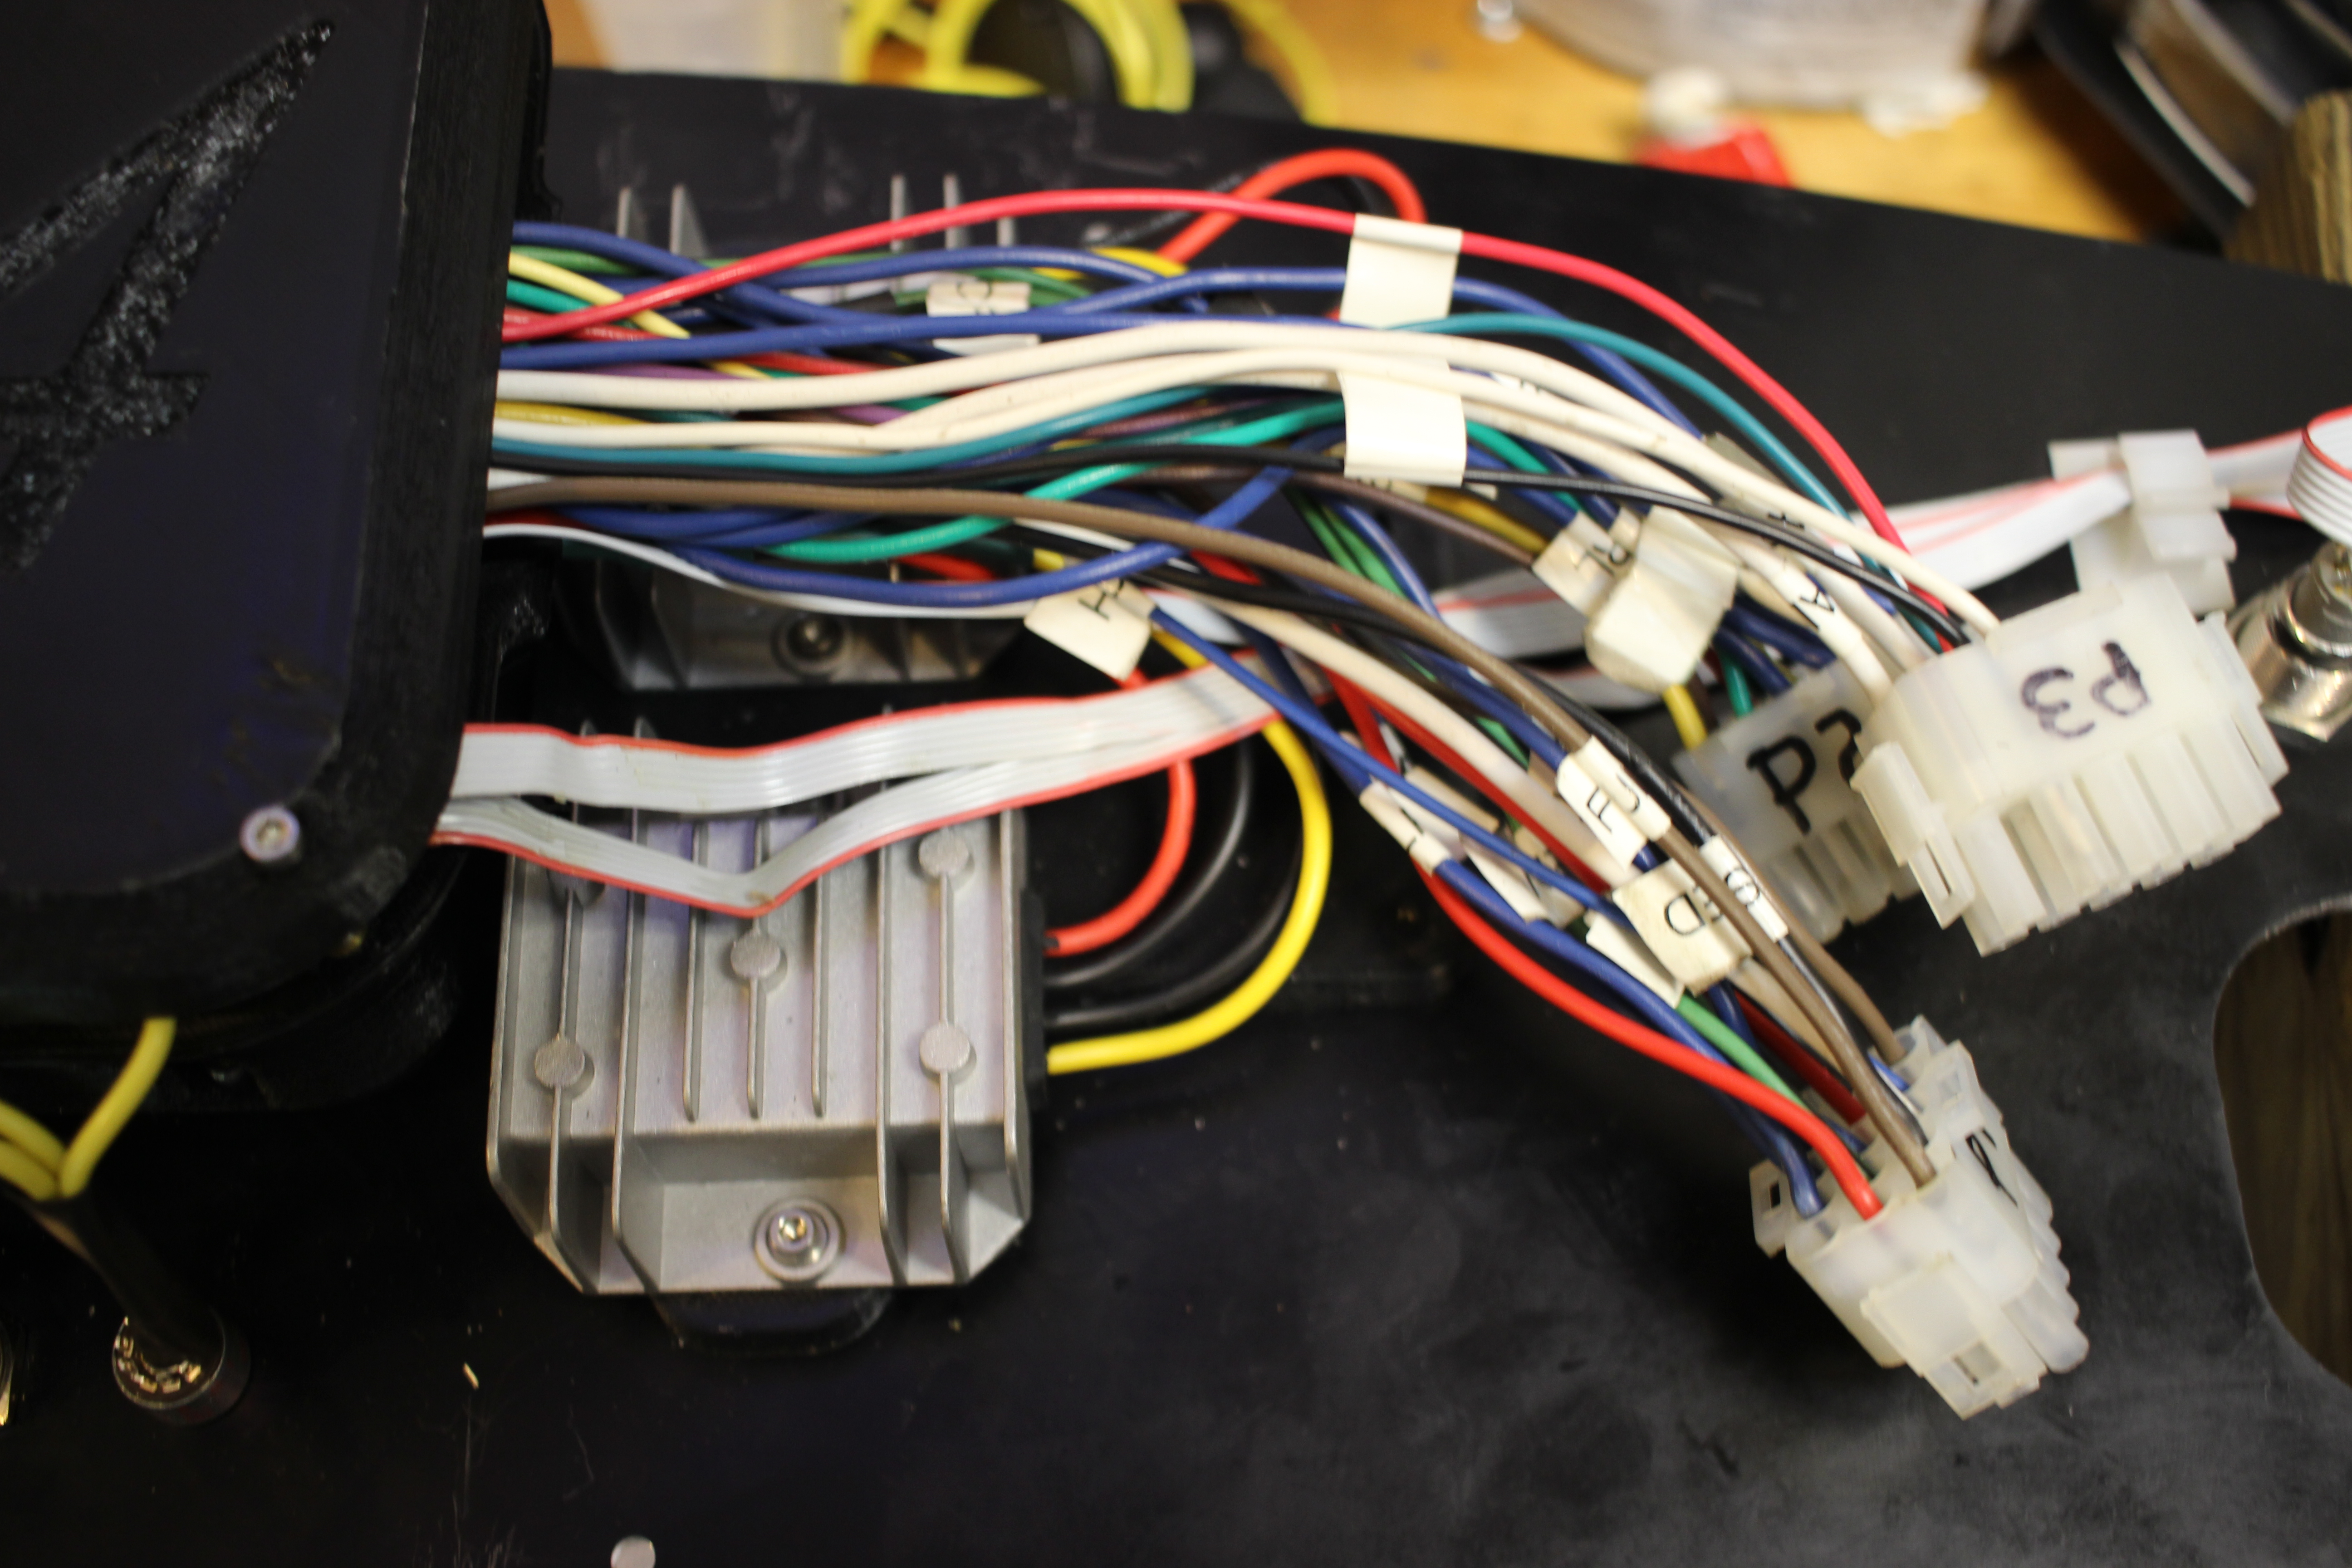
Here is the inside of the car where you can see a usb cable for the backup camera, and the 3 female MOLEX connectors mentioned earlier.
There were a few tricky parts to the circuit design that are worth talking about.
Latching power switch with software-reset
You see these kinds of circuit designs all over the place, and it’s easy to understand why.
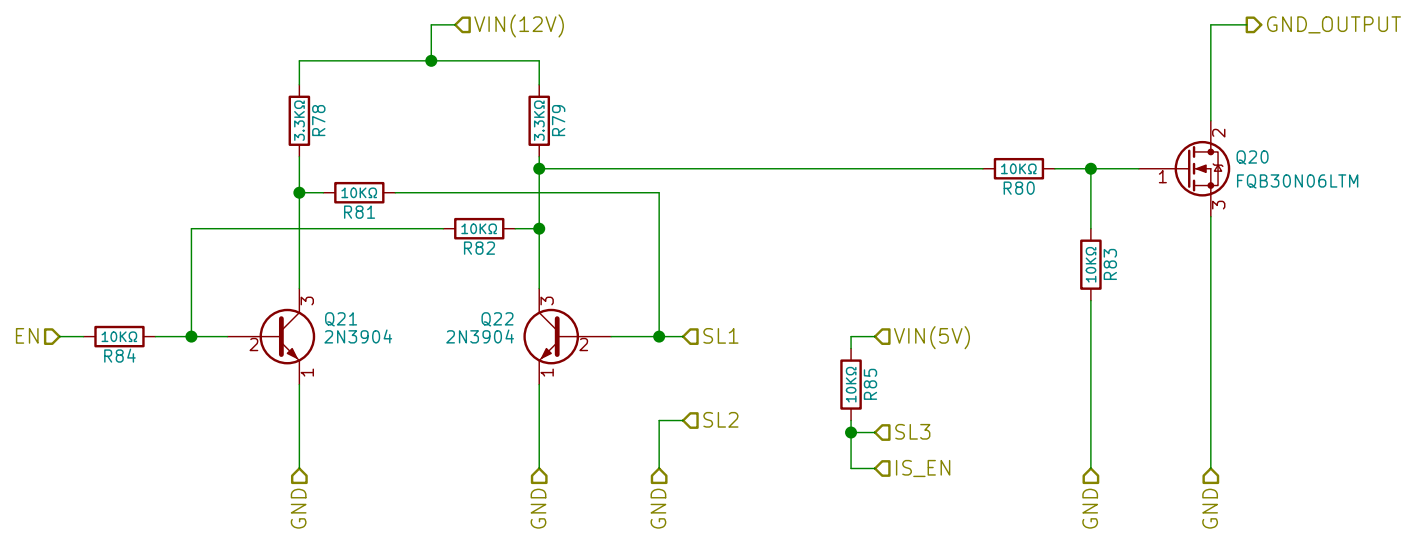
In the off state, “no” current is allowed to flow through Q20 . This turns off the power supply that is powering the Arduino, which will turn of the Pi and it’s Display.
Once the switch attached to SL1-3 (these are legs of a SPDT switch) is turned on, the circuit latches, meaning that if user accidentally flips the switch again, current will still be flowing through Q20. The only way to turn this off is to bring the trace marked EN high using (in this case) the arduino. The arduino reads is_EN to check if the user does want to disable the switch, and when this occurs, a signal is sent to the Pi to make sure it is shut off gracefully before power is cut.
I’ve written more about this circuit and it’s uses here. Here’s a video talking about it as well:
Measuring car speed and engine RPM
The engine has two signal wires coming off of it. One that outputs a square wave pulse every time one of the engine’s cylinders fire, and one that is a sine wave that scales in period and amplitude as the car increases in speed. In the schematic, these are labeled TACK and SPED.
Using an LM339 comparator chip, these signals are both turned into manageable square waves to be read in by the arduino.
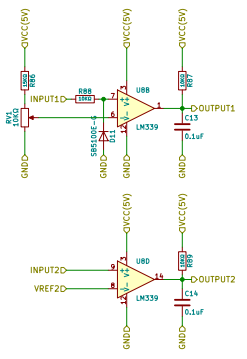
It’s not as easy as an analogRead call to derive speed however, and I had to implement a stateless, multi-channel frequency counter that could not rely at all on delay calls. I’ve written about this design here. As complicated as this is, the resolution is very high, and the two decimal places displayed in the UI are within it’s bandwidth.
You can checkout the full schematic here, I used KiCAD to do schematic capture and PCB layout. Some of the footprints in the KiCAD folder could be useful.
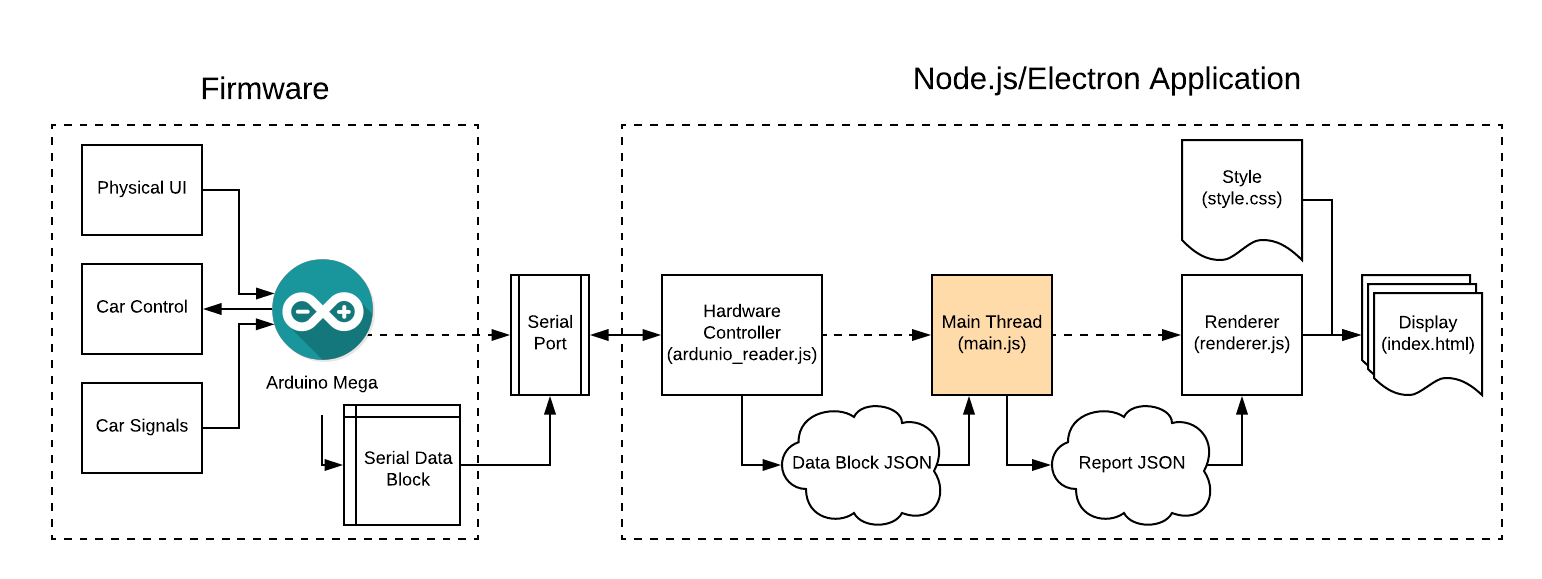
Software Design
The software for this project in two parts. First, there is the firmware running on the arduino attached to the PCB. This handles all of the low level hardware control, and any kind of UI interaction that can happen without the display having to be on. This is written entirely in C++. The display software us running on a Raspberry Pi, and uses Electron to serve the Node.JS GUI.
Microprocessor / Firmware
I knew that this project would eventually be open-sourced, so I took steps to make sure that the standard Arduino bootloader could be used to make sure that other people could gain some knowledge from this project. Not very many of the library functions were used and I had to use some obscure functionality to make everything work. All of the love of open-source right?
The backbone of the firmware is a giant state machine, and each time the state changes, a function is called to handle clean up of the previous and set up for the current one.
The state machine is inside the main loop of the program, and contains no calls to delay() to make sure the hardware UI is snappy.
Pretty much all of the interaction with the actual car (blinkers, horn, starter, fuel level, oil level) doesn’t have to happen quickly at all so overall speed wasn’t a large concern. It is highly important, however, that the state set up and tear down is accurate. For example, when moving from off to on, you’d want to make sure that the car’s starter is disabled.
Display Software and GUI
The display software is an Electron application. Electron is a way to use Javascript for Node in a desktop application. The backend is pretty straight-forward, and most of the complexity comes from converting the raw bytestream from the arduino to graphics on the UI.
The logic for maintaining the backup camera is not as simple however. The camera is a standard USB camera, and it is displayed over the electron UI using a borderless MPlayer window. The problem is that this MPlayer process crashes somewhat randomly. The software has to be able to detect if the process dies and restart it without disturbing the user.
Configuring Raspbian for this application is also quite difficult. Settings have to be tweaked to make sure that the Electron application starts right at boot, and that things like the standard boot messages are hidden, and the desktop elements are removed as well. I have written a one-line command that completely configures the pi and makes all of the necessary UI changes as well as installing all of the software and setting up automatic updates. It is massive, and is as follows:
|
1 |
sudo apt-get update -y && sudo apt-get install git curl unclutter mplayer screen xdotool -y && curl -sL https://deb.nodesource.com/setup_6.x | sudo -E bash - && sudo apt-get install nodejs build-essential -y && git clone https://github.com/hitchco-mk4/Display-Software && cd Display-Software && npm install && sudo python3 edit_cmdline.py && sudo mv /boot/config.txt /boot/config.txt.old && sudo mv config.txt /boot/config.txt && sudo mv /home/pi/.config/lxsession/LXDE-pi/autostart /home/pi/.config/lxsession/LXDE-pi/autostart.old && sudo mv autostart /home/pi/.config/lxsession/LXDE-pi/autostart && sudo mv panel /home/pi/.config/lxpanel/LXDE-pi/panels/panel && sudo touch /home/pi/Desktop/test.desktop && sudo rm /home/pi/Desktop/*.desktop && sudo mv /home/pi/.config/pcmanfm/LXDE-pi/desktop-items-0.conf /home/pi/.config/pcmanfm/LXDE-pi/desktop-items-0.conf.old && sudo mv desktop-items-0.conf /home/pi/.config/pcmanfm/LXDE-pi/desktop-items-0.conf && sudo mv /home/pi/.config/openbox/lxde-pi-rc.xml /home/pi/.config/openbox/lxde-pi-rc.xml.old && sudo mv lxde-pi-rc.xml /home/pi/.config/openbox/lxde-pi-rc.xml && echo "pi:raspberry1" | sudo chpasswd && sudo reboot |
Just as a note, as I write this I’m working to capture visuals going over the GUI. You can follow me on twitter and I’ll post when they’re up.
Data Transfer
The most complicated part of the software as a whole is transferring data very reliably between the arduino and the Pi.
Every time the Arduino moves through the state machine, it processes messages from the Pi. If the Pi is requesting data about the car, the Arduino sends it via Serial3 on the Arduino.
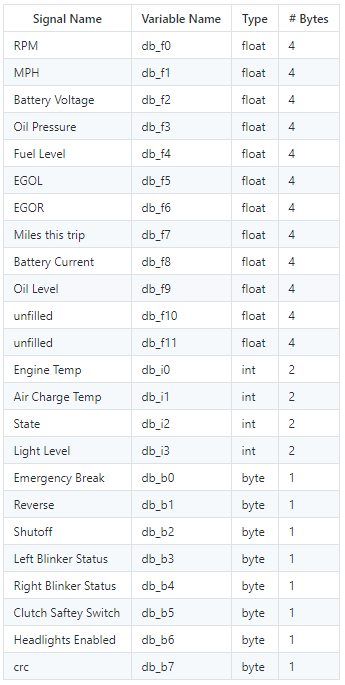
A large buffer of 64 bytes is maintained in memory and transmitted to the Pi. Checksums are used to verify the integrity of the transmission on BOTH sides of the communication, and if one fails, it displays an error on the UI and asks for the data again.
The following table describes how this 64 bytes is laid out:
 That’s pretty much it! The following are miscellaneous pictures of the dashboard.