Desperate times call for desperate measures. I recently found out that a club at my school is essentially a hackerspace equipped with 3D printers so I could finally print enclosures for the PiPlanter and the DSFU. But that means I would need to finial the designs for both of them. I needed to find a way to interface with this thing here. So being the idiot that I am, I forgot a USB keyboard, I forgot an analog video cable, I forgot a monitor for the pi and forgot to update the Pi to the latest Raspian build.
What I did bring was an Easy Cap Capture Card in addition to my standard idea-kit which among other things consists of an Arduino Micro, some buttons, some resistors, and wire.
Essentially all I needed to do was connect the Pi to the EasyCap, and be able to send 4 different phrases to it over the keyboard. I needed to be able to send ‘pi’,’password’ (not my actual password), ‘ifconfig’ and enter. I realized that I could easily send this data to the Pi via the Micro as it has the Keyboard. functions built in.
As you can see in the video it worked! And I’m kind of stunned that it did. I can now SSH into the Pi.
Here’s the code for the Arduino:
C
1
2
3
4
5
6
7
8
9
10
11
12
13
14
15
16
17
18
19
20
21
22
23
24
25
26
27
28
29
30
31
32
33
34
35
36
37
38
39
40
41
42
43
44
45
46
47
48
49
50
51
52
53
54
55
56
57
58
59
60
61
62
63
64
65
66
67
68
69
70
71
72
73
74
75
76
77
78
79
80
81
82
83
84
85
86
intuname=3;
intpass=4;
intcommand=5;
intenter=6;
intgreen=7;
intred=8;
voidsetup(){
pinMode(3,INPUT);
pinMode(4,INPUT);
pinMode(5,INPUT);
pinMode(6,INPUT);
pinMode(7,OUTPUT);
pinMode(8,OUTPUT);
Serial.begin(9600);
Keyboard.begin();
}
voidloop(){
if(digitalRead(uname)==HIGH){
Serial.print("1");
Keyboard.print("pi");
digitalWrite(green,HIGH);
digitalWrite(red,LOW);
delay(1000);
}
else{
Serial.print("0");
digitalWrite(green,LOW);
digitalWrite(red,HIGH);
}
Serial.print(",");
if(digitalRead(pass)==HIGH){
Serial.print("1");
Keyboard.print("password");
digitalWrite(green,HIGH);
digitalWrite(red,LOW);
delay(1000);
}
else{
Serial.print("0");
digitalWrite(green,LOW);
digitalWrite(red,HIGH);
}
Serial.print(",");
if(digitalRead(command)==HIGH){
Serial.print("1");
Keyboard.print("ifconfig");
digitalWrite(green,HIGH);
digitalWrite(red,LOW);
delay(1000);
}
else{
Serial.print("0");
digitalWrite(green,LOW);
digitalWrite(red,HIGH);
}
Serial.print(",");
if(digitalRead(enter)==HIGH){
Serial.print("1");
Keyboard.press(KEY_RETURN);
delay(10);
Keyboard.releaseAll();
digitalWrite(green,HIGH);
digitalWrite(red,LOW);
delay(1000);
}
else{
Serial.print("0");
digitalWrite(green,LOW);
digitalWrite(red,HIGH);
}
Serial.println("");
delay(10);
}
Thanks for Reading!
Hey! This post was written a long time ago, but I'm leaving it up on the off-chance it may help someone. Proceed with caution. It may not be a good idea to blindly integrate this code or work into your project, but instead use it as a starting point.
This post is many months in the making and I am very proud of the thing’s I’ve done here, and very thankful to all of those (specifically at www.reddit.com/r/raspberry_pi) who have helped me along my way to getting this project up and running.
There are 8 parts to this system and, you guessed it, I’ll be going in-depth about every single one!
Sensor Network
So at it’s core, the PiPlanter is a Sensor Network & Pump System. Here’s a video explaining the sensor array:
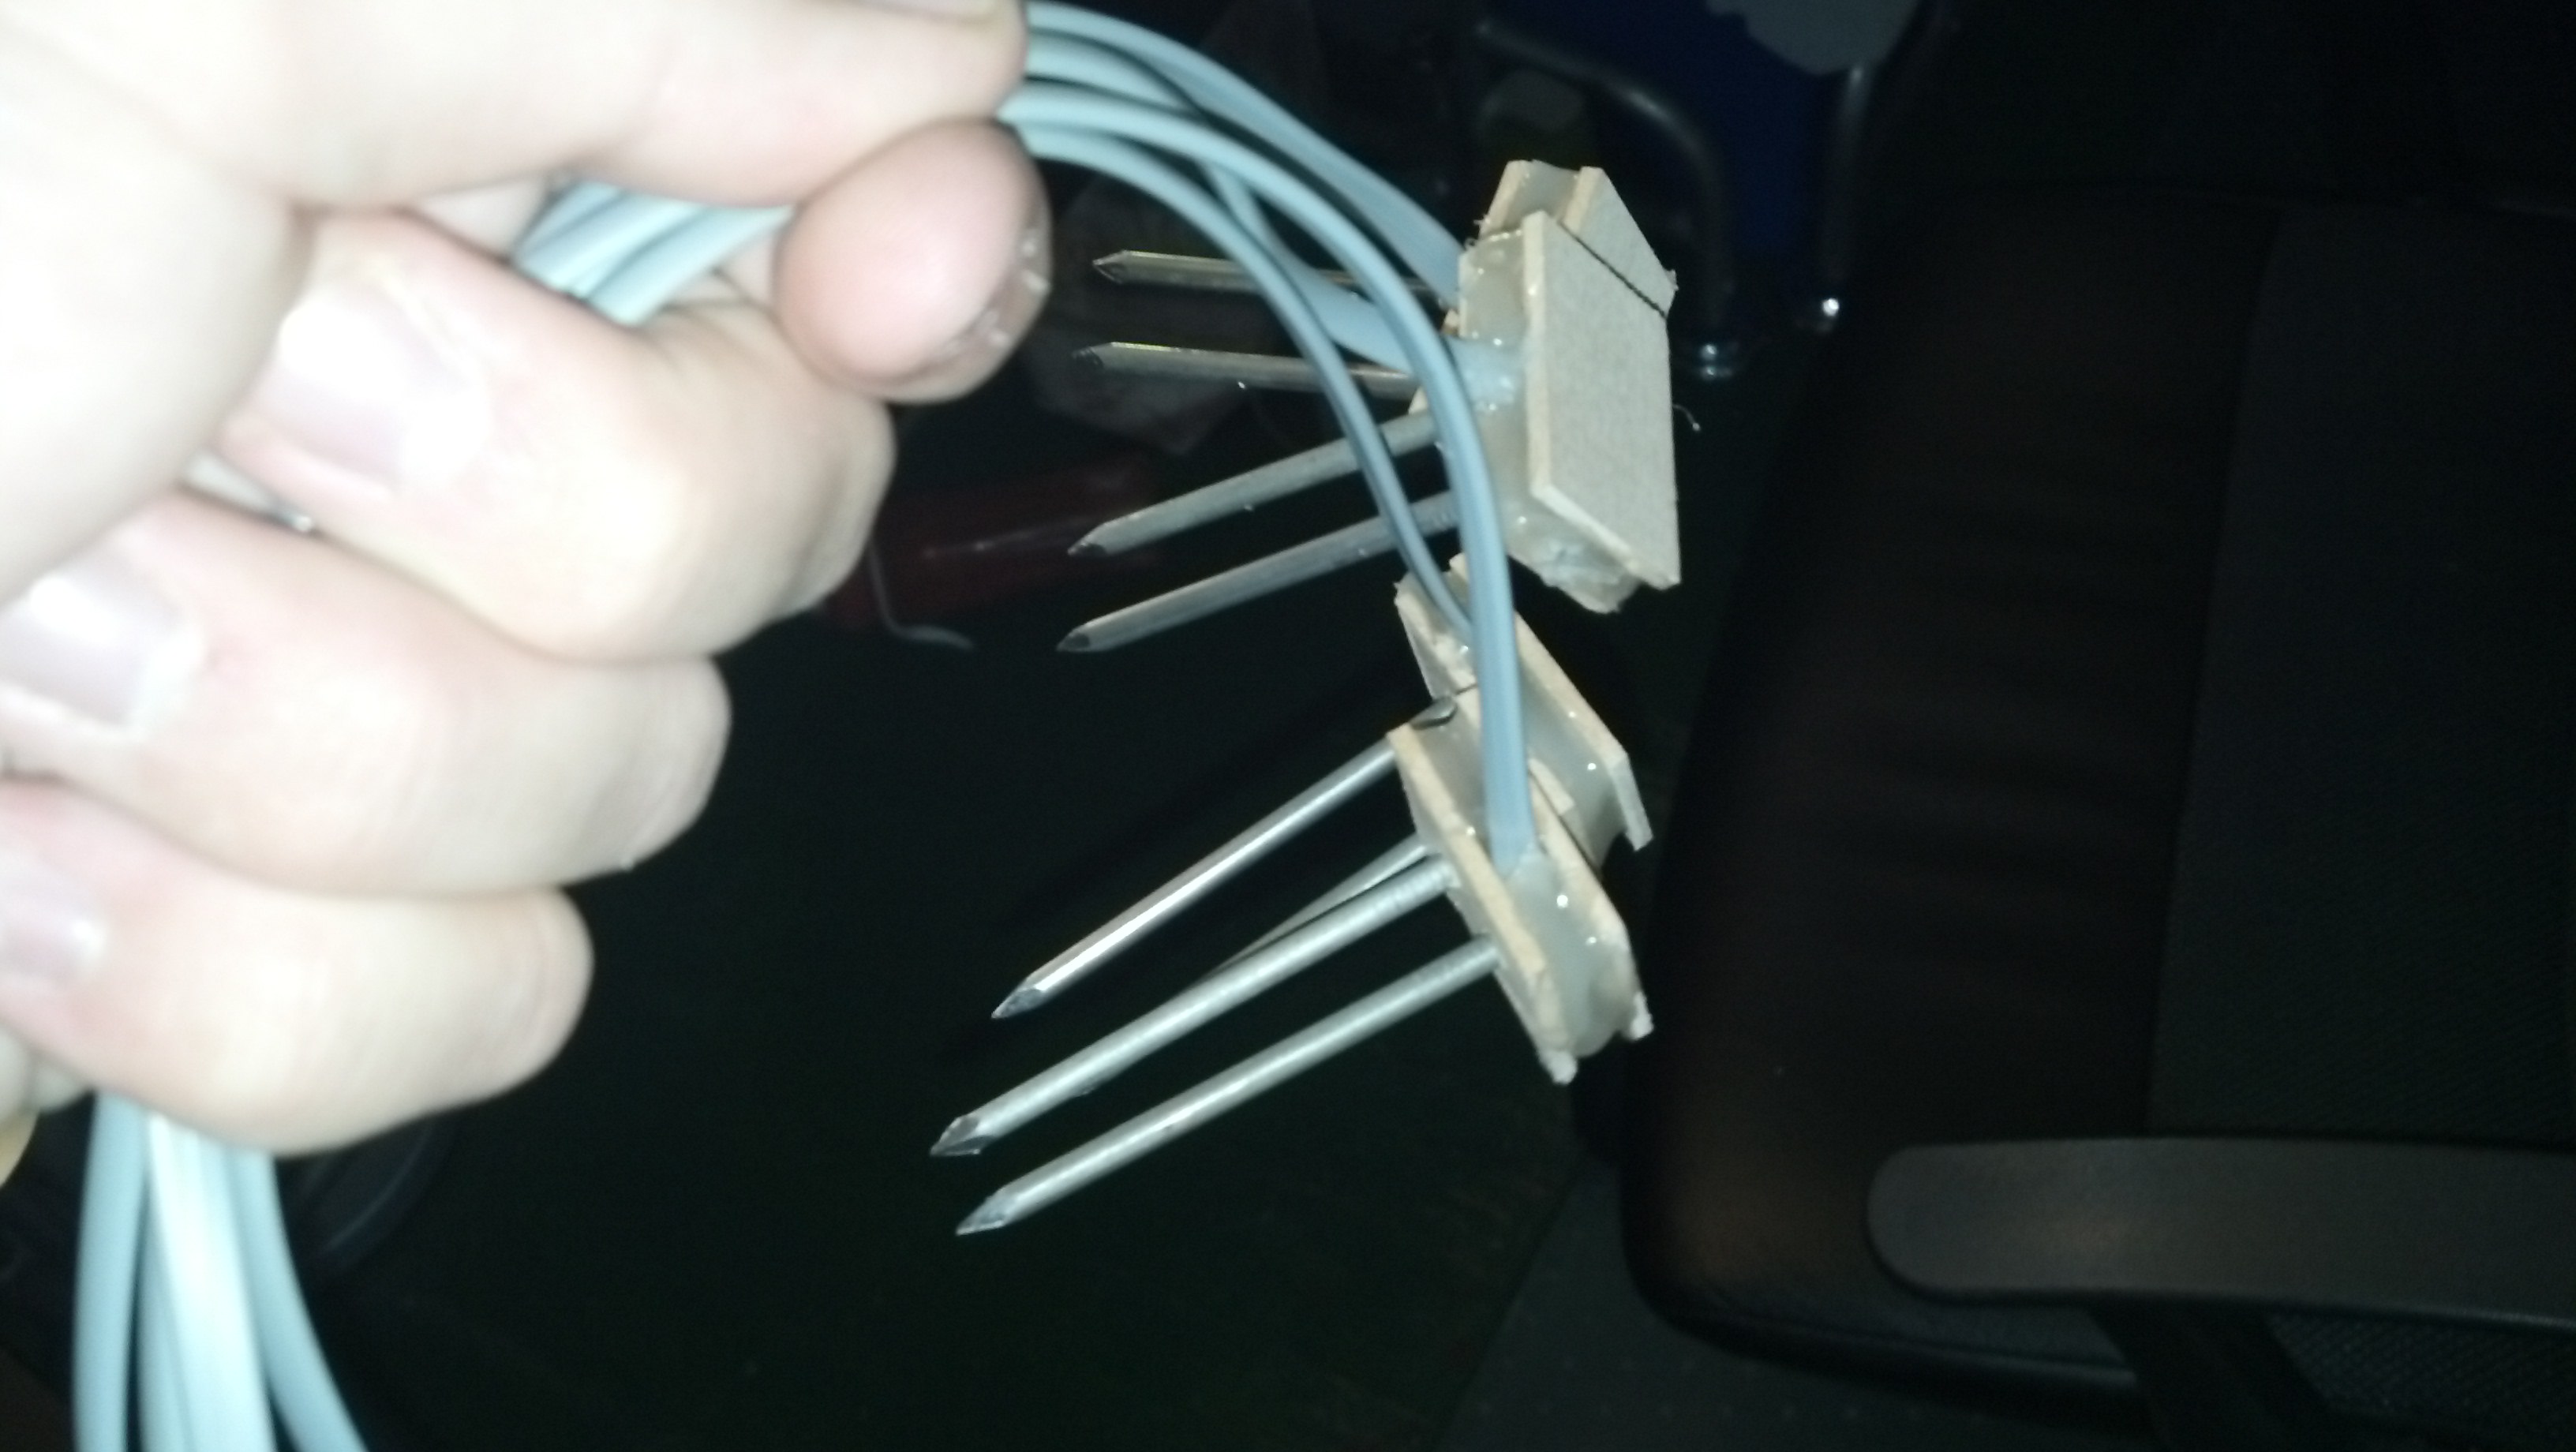
This project uses a TMP35-37 sensor to get a pretty precise temperature reading of the room. Later down in this post you can find out the algorithm to determine the temperature in Fahrenheit. It also uses a basic LDR to get the relative ambient light level in the room. Along with those two sensors, there are 4 relative humidity sensors of my own design, here’s a picture of them as seen in this post:
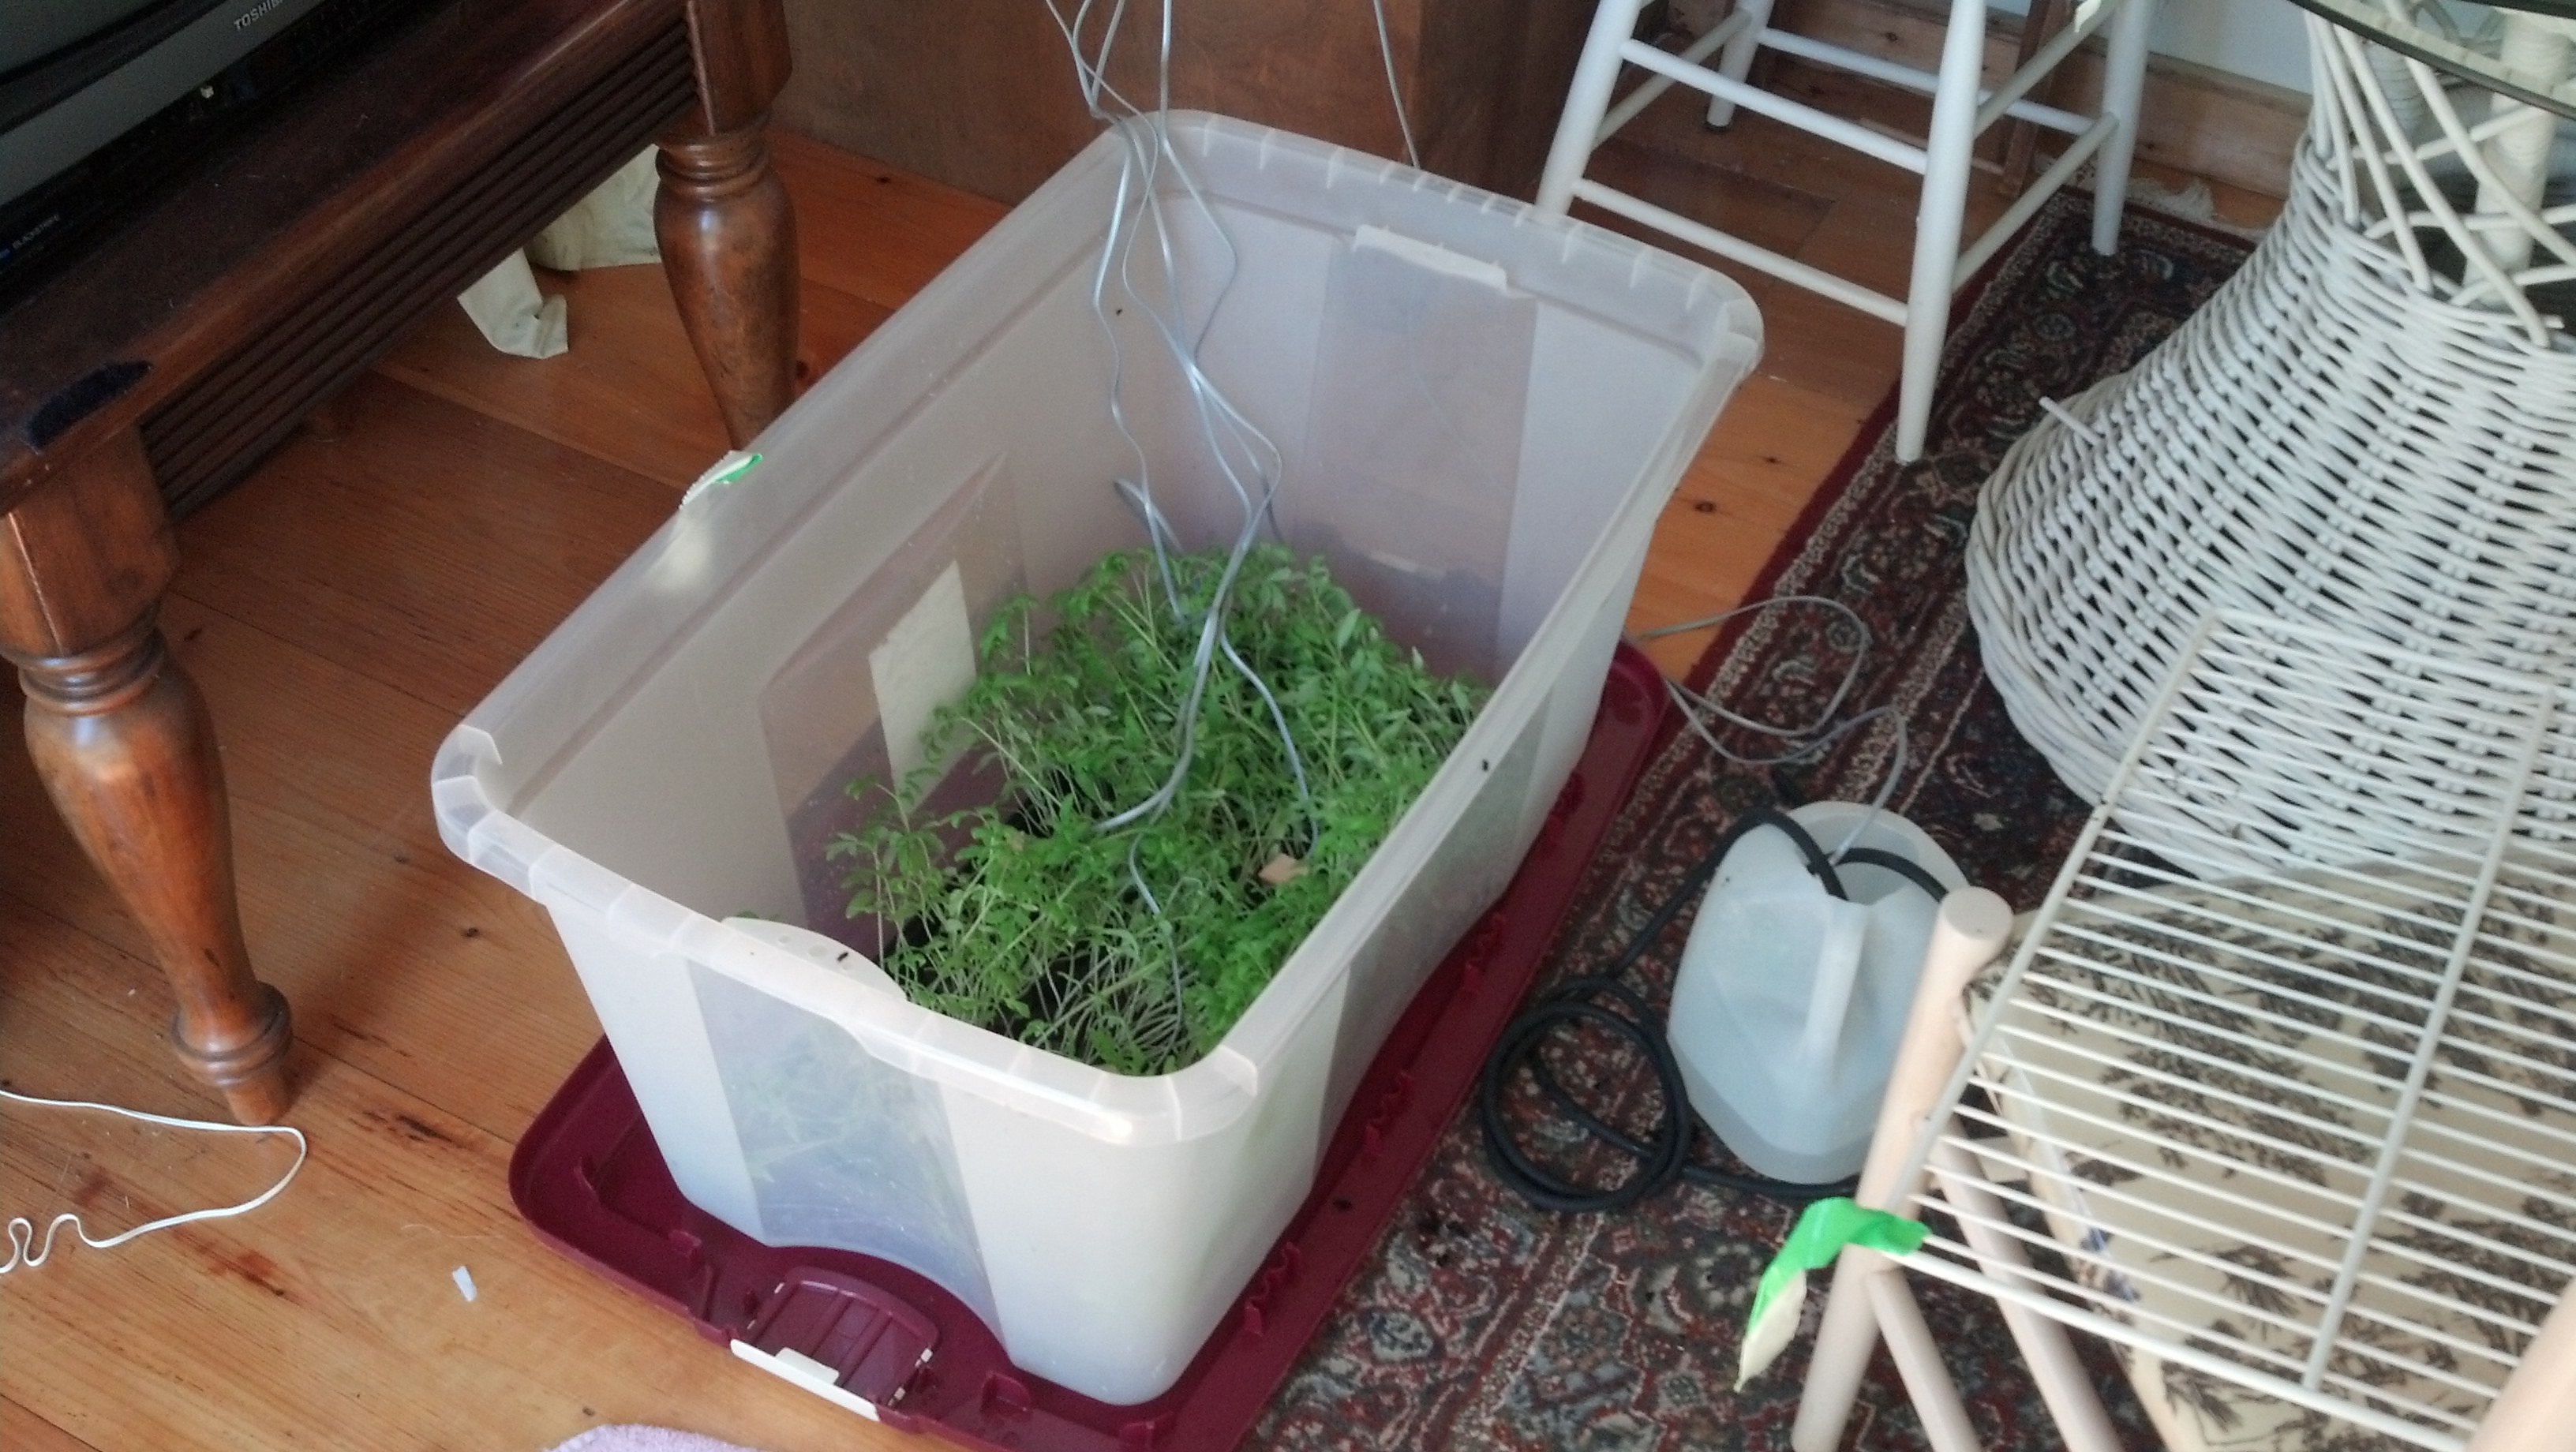
They’re hooked up to the ADC (mentioned later) in the same way that the LDR is, with a voltage dividing resistor, and then fed directly into ADC. The principal behind this sensor is that when you insert it into soil, the water in that soil connected the two probes, causing a voltage to flow across them. So if there is more water in the soil, more electrons will flow across them, and the analog value will be higher. It’s very basic, but it works. I’ve done several long term tests, and over time, as the soil becomes dryer, the value gets lower, indicating relative dryness. Here is a picture of the four probes in the soil, with the plants.
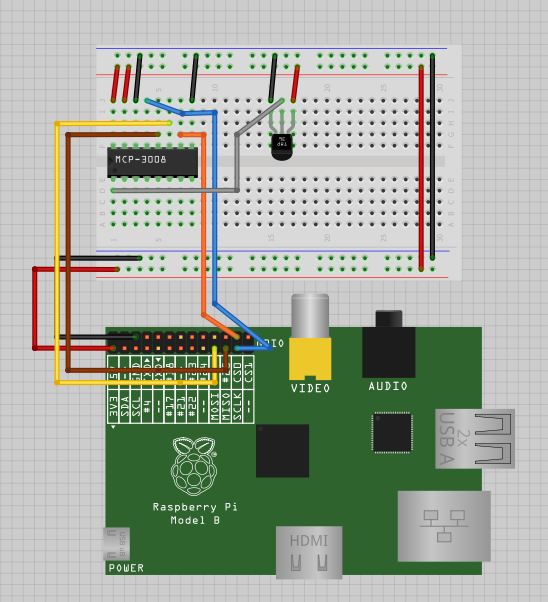
The TMP sensor’s output is plugged directly into the ADC and the LDR is very basically connected to the ADC as well, this is essentially how how the whole thing is setup on the breadboard:
Pump System
The pump system is pretty dead simple. Essentially it is a PowerSwitch Tail II switching the mains to a 9v DC power supply. The 9v power supply is connected directly to a 12v DC submersible pump. Instead of using a motor driver chip, which requires 3 pins to do, and the chip would get hot and whatnot, I’ve decided to go with this method.
The pump is not self priming. This means it cannot make the transition from pumping air to pumping water. I wrestled with this problem for a long time, and came up with what I think is an elegant solution. I submerged the pump directly into the water, which means the pump will never fill with air, and will always pump water when activated. Here’s a video explaining the pump system:
Raspberry Pi ADC
The next system is the ADC connected to the Raspberry Pi. It is an 8 bit, 8 port analog to digital converter that can easily run on 3.3v so it’s perfect for the pi. Here is the chip, and you set it up as follows (I took this from an earlier post I wrote)
Now we need to set up the specific libraries for python the first of which being spidev, the spi tool for the raspberry pi which we can grab from git using the following commands:
Shell
1
2
3
4
5
sudo apt-getinstall git
git clonegit://github.com/doceme/py-spidev
cdpy-spidev/
sudo apt-getinstall python-dev
sudo python setup.pyinstall
You also need to (copied from http://scruss.com/blog/2013/01/19/the-quite-rubbish-clock/):
As root, edit the kernel module blacklist file:
Shell
1
sudo vi/etc/modprobe.d/raspi-blacklist.conf
Comment out the spi-bcm2708 line so it looks like this:
Shell
1
#blacklist spi-bcm2708
Save the file so that the module will load on future reboots. To enable the module now, enter:
Shell
1
sudo modprobe spi-bcm2708
To read from the ADC, add the following to your python code. The full code will be listed later:
Python
1
2
3
4
5
6
7
8
#fuction that can read the adc
defreadadc(adcnum):
# read SPI data from MCP3008 chip, 8 possible adc's (0 thru 7)
ifadcnum>7oradcnum<0:
return-1
r=spi.xfer2([1,8+adcnum<<4,0])
adcout=((r[1]&3)<<8)+r[2]
returnadcout
So just use “readadc(n)” to get a value.
Python Code
I’ve made a real effort this time to comment my code well, so I’m not going to do a line by line breakdown like I often do, but I will clearly state the installs and setup things as follows. I’m assuming you have python-dev installed.
Download and install: APScheduler, this is a very straight forward install
Download and install: tweepy, you will need to go through the API setup process.
Download and install: flickrapi, you will need to go through the API setup process.
Here’s the source code for the python component of this project:
Python
1
2
3
4
5
6
7
8
9
10
11
12
13
14
15
16
17
18
19
20
21
22
23
24
25
26
27
28
29
30
31
32
33
34
35
36
37
38
39
40
41
42
43
44
45
46
47
48
49
50
51
52
53
54
55
56
57
58
59
60
61
62
63
64
65
66
67
68
69
70
71
72
73
74
75
76
77
78
79
80
81
82
83
84
85
86
87
88
89
90
91
92
93
94
95
96
97
98
99
100
101
102
103
104
105
106
107
108
109
110
111
112
113
114
115
116
117
118
119
120
121
122
123
124
125
126
127
128
129
130
131
132
133
134
135
136
137
138
139
140
141
142
143
144
145
146
147
148
149
150
151
152
153
154
155
156
157
158
159
160
161
162
163
164
165
166
167
168
169
170
171
172
173
174
175
176
177
178
179
180
181
182
183
184
185
#Timing setup
fromdatetimeimportdatetime
fromapscheduler.scheduler importScheduler
importtime
importdatetime
importsys
importos
now=datetime.datetime.now()
#import logging #if you start getting logging errors, uncomment these two lines
#logging.basicConfig()
#GPIO setup
importRPi.GPIO asGPIO
GPIO.setmode(GPIO.BOARD)
GPIO.cleanup()
pin=26#pin for the adc
GPIO.setup(pin,GPIO.OUT)
NPNtrans=3#the pin for the npn transistor
GPIO.setup(NPNtrans,GPIO.OUT)
sampleLED=5#the indicator LED
GPIO.setup(sampleLED,GPIO.OUT)
pump=7#pin for the pump
GPIO.setup(pump,GPIO.OUT)
#the adc's SPI setup
importspidev
spi=spidev.SpiDev()
spi.open(0,0)
#sets up the program's ability to write to a mysql database
ifnottoken:raw_input("Press ENTER after you authorized this program")
flickr.get_token_part_two((token,frob))
#Variable Setup
ontime=20
#fuction that can read the adc
defreadadc(adcnum):
# read SPI data from MCP3008 chip, 8 possible adc's (0 thru 7)
ifadcnum>7oradcnum<0:
return-1
r=spi.xfer2([1,8+adcnum<<4,0])
adcout=((r[1]&3)<<8)+r[2]
returnadcout
defslowSample():
date0="21-06-2013 15"
date1="25-06-2013 12"
date2="29-06-2013 12"
date3="04-07-2013 12"
date4="06-07-2013 12"
ifstr(time.strftime('%d-%m-%Y %H'))==date0:
water()
ifstr(time.strftime('%d-%m-%Y %H'))==date1:
water()
ifstr(time.strftime('%d-%m-%Y %H'))==date2:
water()
ifstr(time.strftime('%d-%m-%Y %H'))==date3:
water()
ifstr(time.strftime('%d-%m-%Y %H'))==date4:
water()
print"----------start----------"
GPIO.output(NPNtrans,True)
GPIO.output(sampleLED,True)
time.sleep(1)
sampleTime=time.ctime()
mst1=readadc(0)
mst2=readadc(1)
mst3=readadc(2)
mst4=readadc(3)
pot1=readadc(4)
ldr1=readadc(5)
millivolts=readadc(6)*(3300.0/1024.0)
temp_c=((millivolts-100.0)/10)-40.0
tmp1=(temp_c*9.0/5.0)+32
#prints debug info to console
printsampleTime,"|","MST1:",mst1,"MST2:",mst2,"MST3:",mst3,"MST4:",mst4,"Pot1:",pot1,"LDR1:",ldr1,"TMP1:",tmp1#prints the debug info
#adds the data to the mysql table
cursor.execute("INSERT INTO piplanter_table_17(Time,mst1_V,mst2_V,mst3_V,mst4_V,pot1_V,ldr1_V,tmp1_F) VALUES(%s,%s,%s,%s,%s,%s,%s,%s)",(sampleTime,mst1,mst2,mst3,mst4,pot1,ldr1,tmp1))
con.commit()#this is important for live updating
GPIO.output(NPNtrans,False)#turns the probes off
#renders the image of the graph
print"render start"
os.system("php /opt/bitnami/apps/wordpress/htdocs/piplanter/renderScript.php")#renders the .png file
slowSample()#runs the sample once before the interval starts, mostly a debug function
scheduler=Scheduler(standalone=True)
scheduler.add_interval_job(slowSample,hours=1)
scheduler.start()#runs the program indefianately once every hour
There you go! Essentially, every hour, the raspberry pi samples data from 4 humidity probes, an LDR and a tmp sensor. Once the sampling is complete, it dumps the data into a mysql database. From there the data is rendered into a graph using pChart in the form of a .png image. From there, that .png files is uploaded to flickr using this api. Once the file is uploaded, it returns it’s photo ID to the python script. From there, a tweet is built containing the brightness at the time of the tweet, the temperature at the time of the tweet, and the average moisture of the plants. It also uses the photo ID from flickr obtained earlier to build a URL leading to that image on flickr which it tweets as well. The final part of the tweet is a url that leads to this post! (taken from)
MySQL Database
The database is extremely simple, after installing MySQL set it up and create table that follows this syntax:
Pretty basic stuff, the table is just where the python script dumps the data every hour.
PChart Graph
The software driving the graphing part of the project is a bit of php graphing software called pchart. It allows me to graph mysql values from a table in a variety of ways. It is very important, and the code for the php script is as follows:
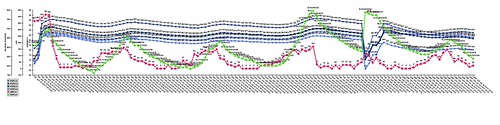
As you may be able to guess, upon the calling of this script, the program looks for a table called “piplanter_table_17” and does a bunch of stuff as commented to produce a graph. This is what a sample graph looks like:
This is data taken over 6 days, and it’s a lot to look at, but it’s good stuff.
Twitter & Flickr Integration
As you hopefully derived from the python code, this project uses Twitter to send data to me. Instead of using an email server or sending sms messages, I decided on twitter because of a few reasons. I use the service constantly, so I won’t ever miss a tweet. The API seemed really easy to use (and it was!) and allowed more than one person to acess the data at any one time. I decided to use flickr as my image hosting service for a lot of the same reasons, but the main one was their 1TB storage per person. You’ve already seen a sample flickr upload, so here’s a sample tweet:
That’s essentially it! Thank you for reading, and please ask questions.
Hey! This post was written a long time ago, but I'm leaving it up on the off-chance it may help someone. Proceed with caution. It may not be a good idea to blindly integrate this code or work into your project, but instead use it as a starting point.
I’m taking a “break” from my drone while I save some money to buy more tricopter parts, and since the weather’s getting nicer and nicer I’ve decided to start working on my PiPlanter again.
As a refresher, the PiPlanter is a Raspberry Pi powered garden. The goal is for it to just be able to be plugged in and add water to a water source and have the Pi monitor temp and moisture levels to be able to add more water as needed.
I’ve shown that is relatively easy to go from analog sensors to good looking tables and graphs using the raspberry pi, the problem that I ran into however was timing.
It became harder and harder to use the time.sleep function in python to handle long periods of time. When you are dealing with things like plants, you don’t need to water it very often, but for data’s sake, you should be polling the sensors a lot.
I’ve landed on the use of APScheduler in python, and here’s my source code:
[py]
#Timing setup
from datetime import datetime
from apscheduler.scheduler import Scheduler
import time
import logging #if you start getting logging errors, uncomment these two lines
logging.basicConfig()
#GPIO setup
import RPi.GPIO as GPIO
GPIO.setmode(GPIO.BOARD)
GPIO.cleanup()
pin = 26 #pin for the adc
GPIO.setup(pin, GPIO.OUT)
led1 = 11 #pin for the short indicator led
GPIO.setup(led1, GPIO.OUT)
led2 = 13 #pin for other long indicator led
GPIO.setup(led2, GPIO.OUT)
#fuction that can read the adc
def readadc(adcnum):
# read SPI data from MCP3008 chip, 8 possible adc’s (0 thru 7)
if adcnum > 7 or adcnum < 0:
return -1
r = spi.xfer2([1, 8 + adcnum << 4, 0])
adcout = ((r[1] & 3) << 8) + r[2]
return adcout
def rapidSample():
sampleTemp1 = (((readadc(0)*3.3)/1024)/(10.0/1000)) #this translates the analog voltage to temperature in def F
sampleLght1 = readadc(1)
samplePot1 = readadc(2)
GPIO.output(led1, True) #turns the led on
time.sleep(.1) #sleeps a little bit so you can see the LED on
print "Job 1", datetime.now(),"LDR:",sampleLght1 ,"Pot:",samplePot1,"Temp:",sampleTemp1 #prints the debug info
time.sleep(.1)
GPIO.output(led1, False) #turns the led off
def slowSample():
print "Job 2" , datetime.now()
GPIO.output(led2, True) #turns the led on
time.sleep(5)
GPIO.output(led2, False) #turns the led on
if __name__ == ‘__main__’:
#the following 3 lines start up the interval job and keep it going
scheduler = Scheduler(standalone=True)
scheduler.add_interval_job(rapidSample, seconds=1)
scheduler.add_interval_job(slowSample, minutes=1)
scheduler.start()
[/py]
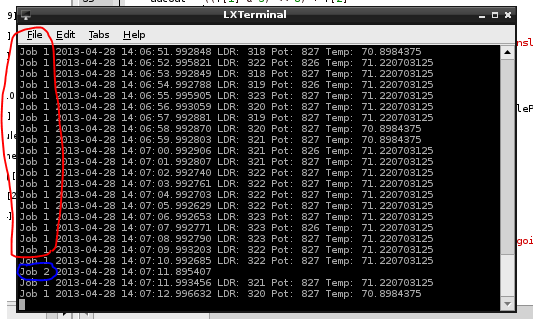
This produces a loop that flashed a green led on and of for .1 seconds at a time per second, and then every minute, turns on a speaker and a red led for 5 seconds then turns it off. There are some images of what goes on below.
Here is a picture of the the print dialog in python:
You can see that the first job (green led) posts the values from the analog sensors every second
The second job (red led) just posts the time. But the function is expandable to do anything at any time.
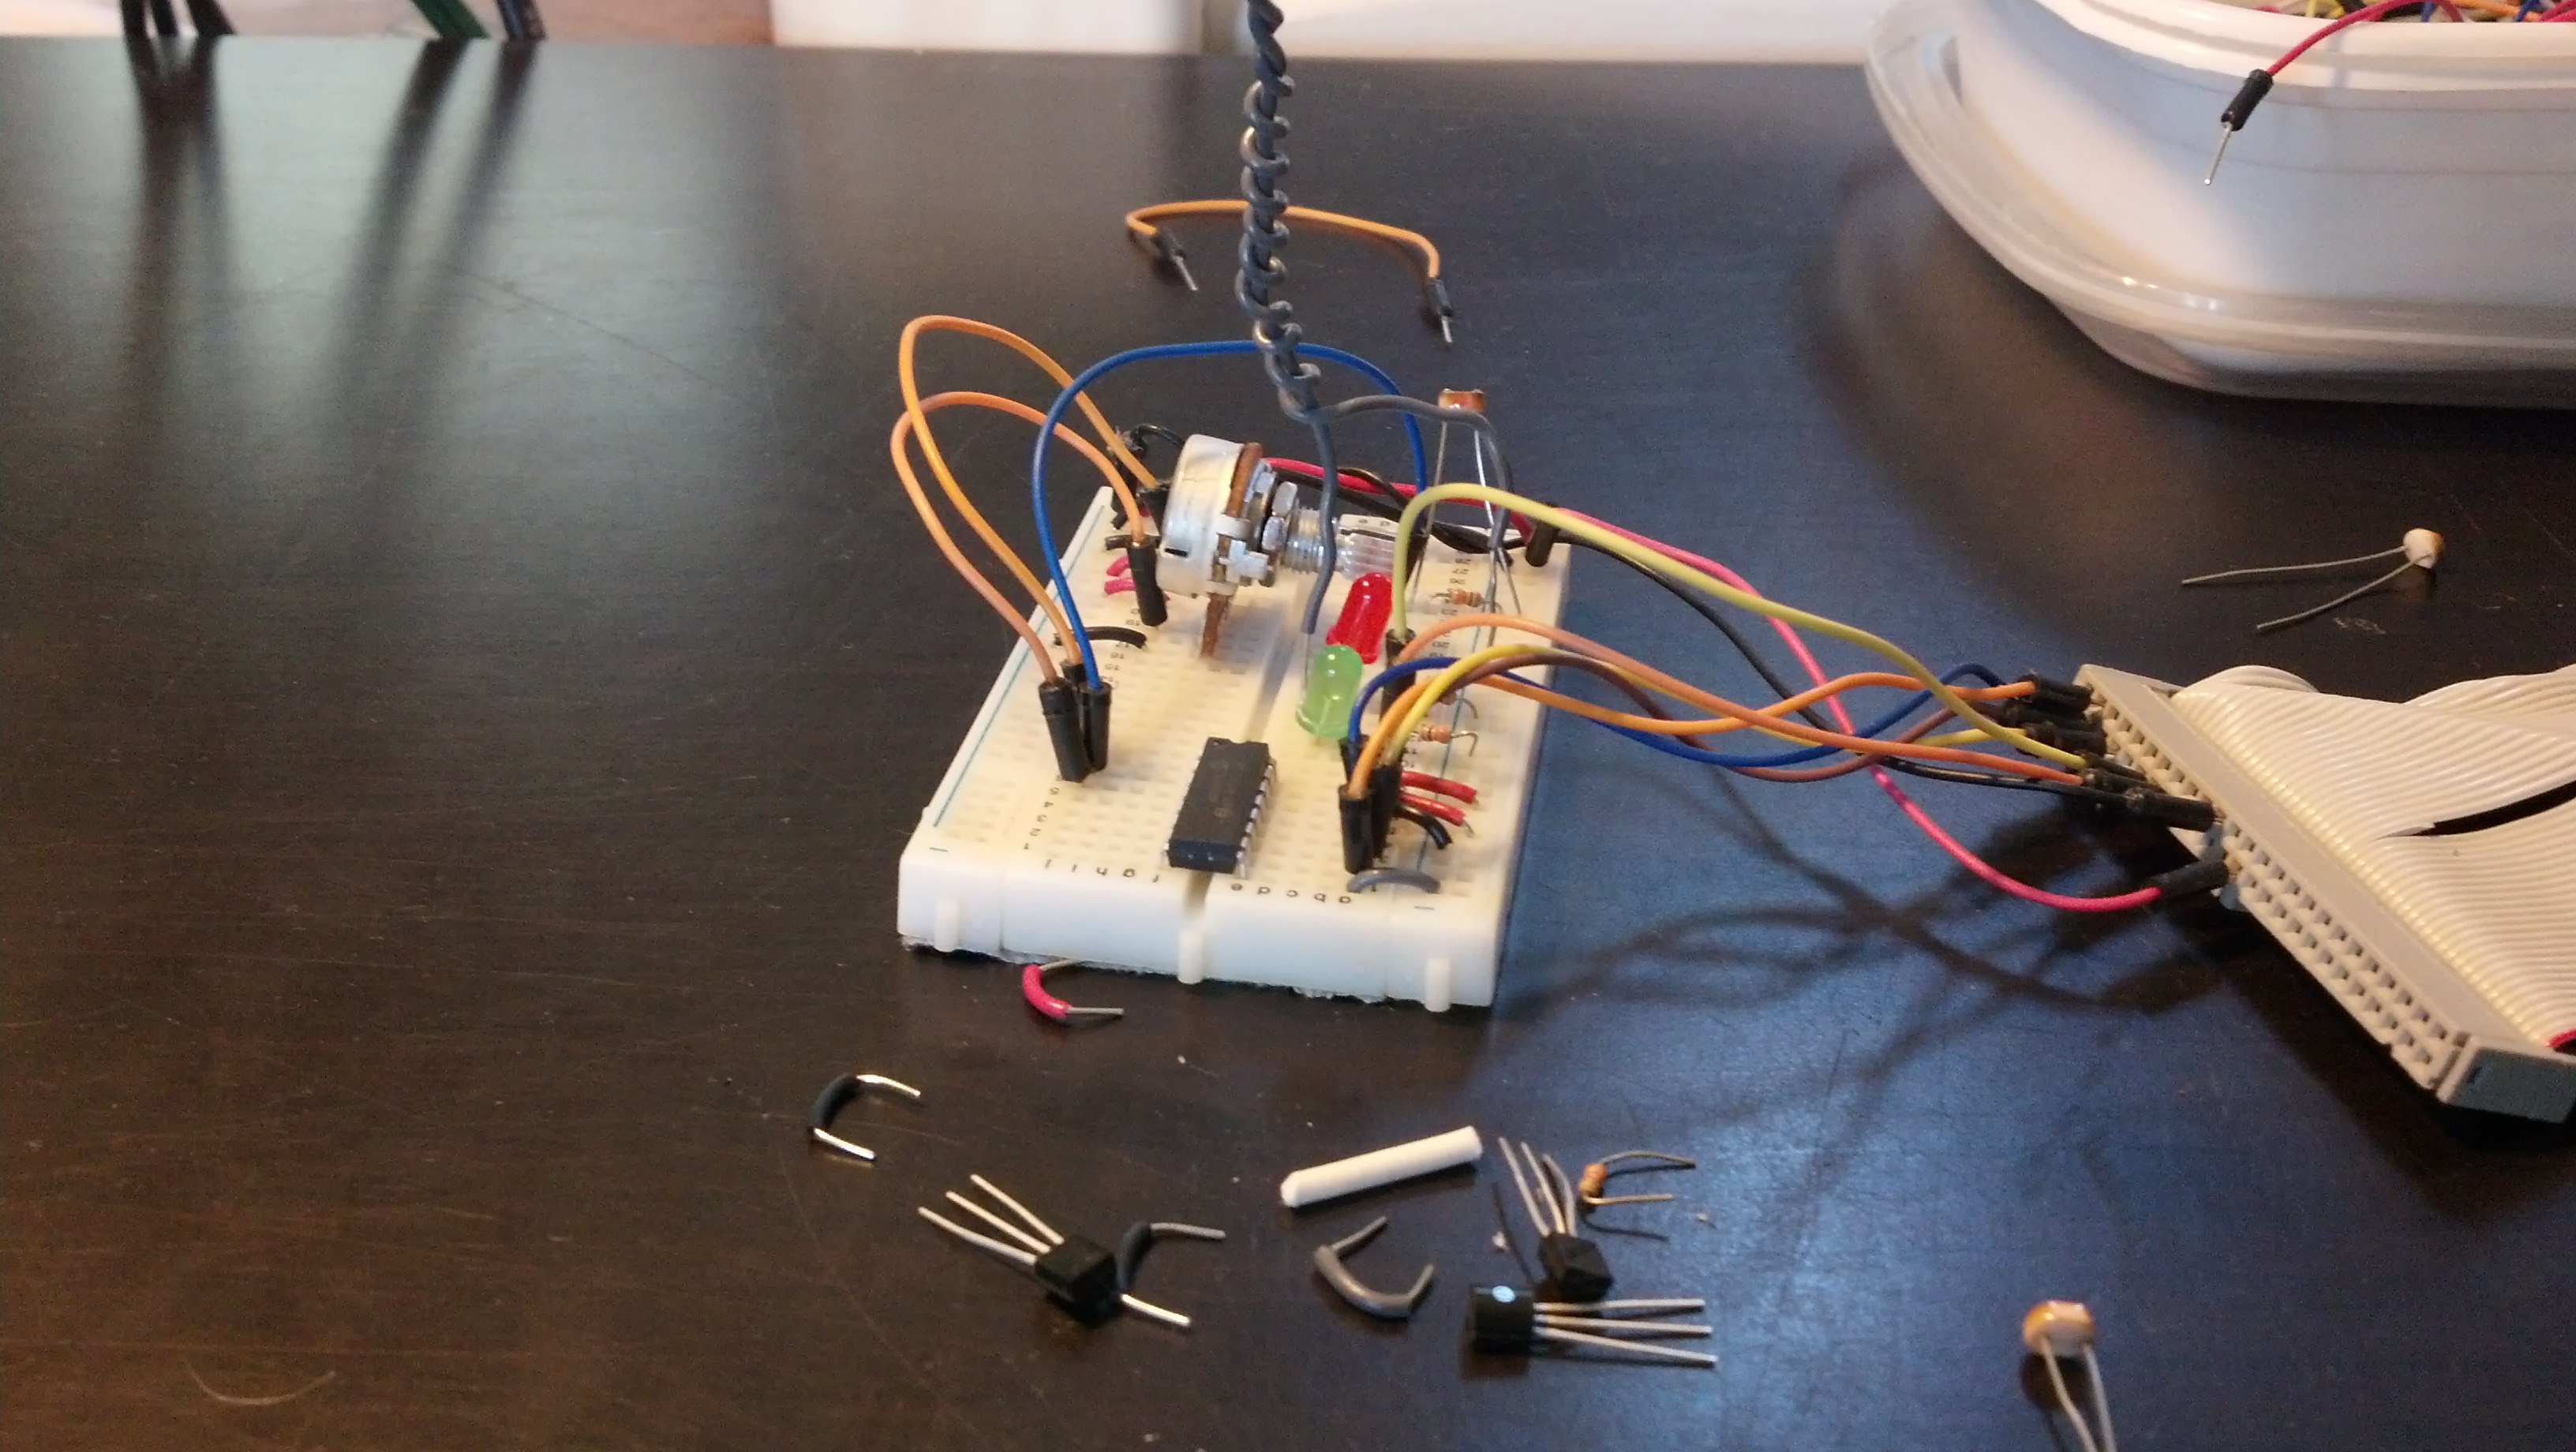
Here are pictures of the board and the circuit in action:
Both LED’s off
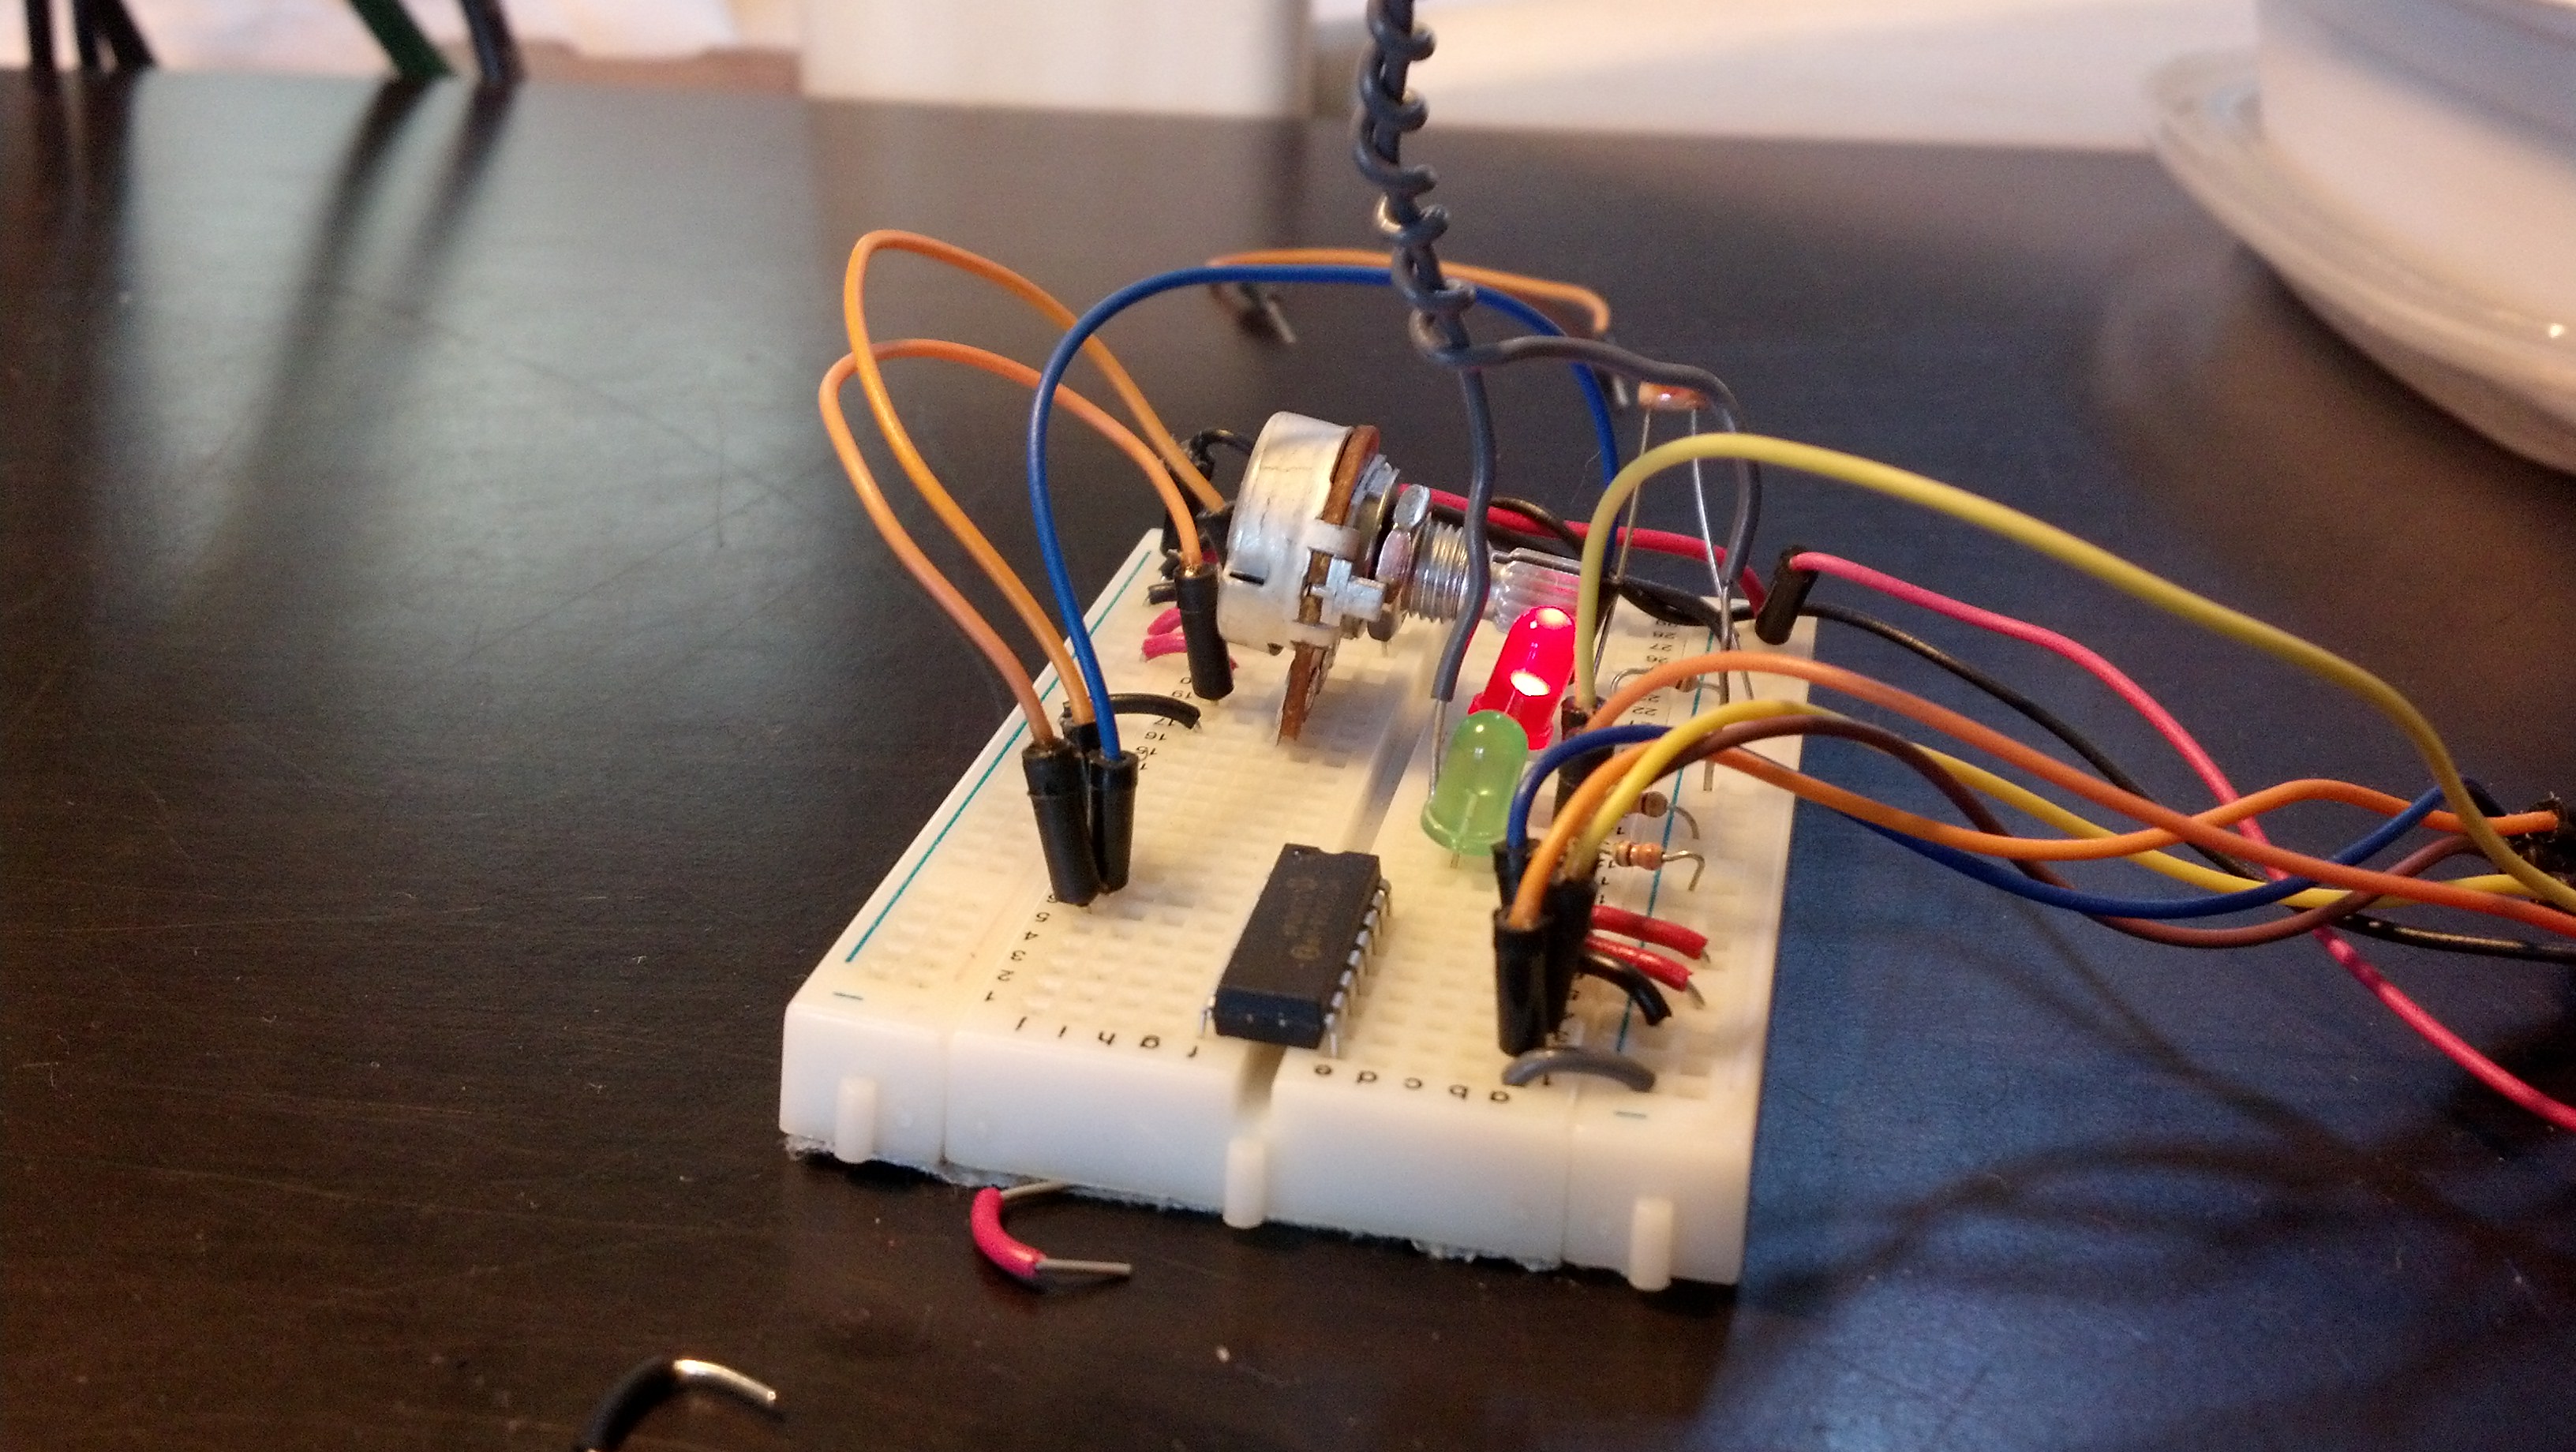
The Green LED on, the red circled process in the printout
Here are both on
The next step is adding the mySQL in as seen in some other posts.
Hey! This post was written a long time ago, but I'm leaving it up on the off-chance it may help someone. Proceed with caution. It may not be a good idea to blindly integrate this code or work into your project, but instead use it as a starting point.
Hello! as you can probably tell, my last post was written in a fury of incoherency, but I needed to get the code out there so it is what it is.
The main focus of this post is to showcase the arduino program. The visual basic in the video is very simple, and there will be much more on that later.
This below program will take a string of characters fed to the arduino and split them into usable parts. This is a very valuable tool for working with serial and arduino. It’s pretty well commented, but if you have any questions, PLEASE leave a comment. I’d love to see some conversation here.
C
1
2
3
4
5
6
7
8
9
10
11
12
13
14
15
16
17
18
19
20
21
22
23
24
25
26
27
28
29
30
31
32
33
34
35
36
37
38
39
40
41
42
43
44
45
46
47
48
49
50
51
constcharEOPmarker='.';//This is the end of packet marker
charserialbuf[32];//This gives the incoming serial some room. Change it if you want a longer incoming.
#include <string.h> // we'll need this for subString
#define MAX_STRING_LEN 20 // like 3 lines above, change as needed.
#include <LiquidCrystal.h> //we'll need this for the lcd
LiquidCrystal lcd(7,8,9,10,11,12);//pins for the lcd, I set it up using the ladyada tutorial.
voidsetup(){
lcd.begin(16,2);
Serial.begin(9600);//changing this to other speeds has not been tested using this meathod
}
voidloop(){
if(Serial.available()>0){//makes sure something is ready to be read
lcd.clear();//clears for incoming stuff, won't clear if there isin't data to be read
staticintbufpos=0;//starts the buffer back at the first position in the incoming serial.read
charinchar=Serial.read();//assigns one byte (as serial.read()'s only input one byte at a time
if(inchar!=EOPmarker){//if the incoming character is not the byte that is the incoming package ender
serialbuf[bufpos]=inchar;//the buffer position in the array get assigned to the current read
bufpos++;//once that has happend the buffer advances, doing this over and over again until the end of package marker is read.
}
else{//once the end of package marker has been read
serialbuf[bufpos]=0;//restart the buff
bufpos=0;//restart the position of the buff
lcd.write(subStr(serialbuf,",",1));//witres the first bit of content before the first comma (or other seperator) to the lcd. You could also do math or anything else with these. You could use atoi to change them to integers.
lcd.write("|separator|");//this signifies that the first seperation has occured
lcd.write(subStr(serialbuf,",",2));//same thing as 2 lines above, but with the second parts. this can be repeated
}
}
}
// below is just function logic, which I do not fully understand. but it works.
//Thanks to http://arduino.cc/forum/index.php?topic=119429
So for example if you inputted
[code]
123,456.
[/code]
it would output
[code]
123|separator|456
[/code]
to the lcd, or the serial monitor if you tweaked the code.
Now for the code in the video. The only different part about this is that it writes the two values to the servos.
C
1
const char EOPmarker = ‘.’; //This is the end of packet marker
char serialbuf[32]; //This gives the incoming serial some room. Change it if you want a longer incoming.
#include // we’ll need this for subString
#define MAX_STRING_LEN 20 // like 3 lines above, change as needed.
#include //we’ll need this for the lcd
LiquidCrystal lcd(7, 8, 9, 10, 11, 12); //pins for the lcd, I set it up using the ladyada tutorial.
#include
Servo left_servo;
Servo right_servo;
int left_servo_pos;
int right_servo_pos;
void setup(){
lcd.begin(16, 2);
left_servo.attach(2);
right_servo.attach(3);
Serial.begin(9600); //changing this to other speeds has not been tested using this meathod
}
void loop() {
if (Serial.available() > 0) { //makes sure something is ready to be read
lcd.clear(); //clears for incoming stuff, won’t clear if there isin’t data to be read
static int bufpos = 0; //starts the buffer back at the first position in the incoming serial.read
char inchar = Serial.read(); //assigns one byte (as serial.read()’s only input one byte at a time
if (inchar != EOPmarker) { //if the incoming character is not the byte that is the incoming package ender
serialbuf[bufpos] = inchar; //the buffer position in the array get assigned to the current read
bufpos++; //once that has happend the buffer advances, doing this over and over again until the end of package marker is read.
}
else { //once the end of package marker has been read
serialbuf[bufpos] = 0; //restart the buff
bufpos = 0; //restart the position of the buff
left_servo_pos = atoi(subStr(serialbuf, “,”, 1));
lcd.write(“Left Servo:”);
lcd.write(subStr(serialbuf, “,”, 1)); //witres the first bit of content before the first comma (or other seperator) to the lcd
left_servo.write(left_servo_pos);
lcd.setCursor(0, 1);
right_servo_pos = atoi(subStr(serialbuf, “,”, 2));
lcd.write(“Right Servo:”); //this signifies that the first seperation has occured
lcd.write(subStr(serialbuf, “,”, 2)); //same thing as 2 lines above, but with the second parts. this can be repeated
right_servo.write(right_servo_pos);
}
}
}
// below is just function logic, which I do not fully understand. but it works.
char* subStr (char* input_string, char *separator, int segment_number) {
char *act, *sub, *ptr;
static char copy[MAX_STRING_LEN];
int i;
strcpy(copy, input_string);
for (i = 1, act = copy; i <= segment_number; i++, act = NULL) {
sub = strtok_r(act, separator, &ptr);
if (sub == NULL) break;
}
return sub;
}
//www.esologic.com
//Thanks to http://arduino.cc/forum/index.php?topic=119429
Hey! This post was written a long time ago, but I'm leaving it up on the off-chance it may help someone. Proceed with caution. It may not be a good idea to blindly integrate this code or work into your project, but instead use it as a starting point.
This is a round about way of using a servo to move an analog sensor to 3 points to triangulate the servo degree where the photocell experiences the most light.
The servo sweeps back and forth and then another servo points to where the brightest point was.
It is very simple wiring, but the code is a little fancy. It’s all commented up here, but as always deduction is your friend.
Raspberry pi soon?
Hey! This post was written a long time ago, but I'm leaving it up on the off-chance it may help someone. Proceed with caution. It may not be a good idea to blindly integrate this code or work into your project, but instead use it as a starting point.
Anyways! I’ve set aside my home automation project and picked up a few of these shift registers: the 74hc595 by TI, seen here:
As seen in the video above, I’m controlling 14 led’s using two of the 74hc595s and and 3 pins on an Arduino Uno.
The program uses a for loop and cycles through the 14 pins on the registers. That code can be found here. Thanks for reading, check back soon for updates on the home automation project.
Hey! This post was written a long time ago, but I'm leaving it up on the off-chance it may help someone. Proceed with caution. It may not be a good idea to blindly integrate this code or work into your project, but instead use it as a starting point.