So I’m on vacation, and I needed a way to do some raspberry pi work while I’m away from my primary workstation.
I don’t have a wireless dongle, and running an ethernet cable isn’t an option, so I decided to go with an EasyCap capture card and a usb keyboard.
Here’s a video explaining my setup:
Hey! This post was written a long time ago, but I'm leaving it up on the off-chance it may help someone. Proceed with caution. It may not be a good idea to blindly integrate this code or work into your project, but instead use it as a starting point.
This post is many months in the making and I am very proud of the thing’s I’ve done here, and very thankful to all of those (specifically at www.reddit.com/r/raspberry_pi) who have helped me along my way to getting this project up and running.
There are 8 parts to this system and, you guessed it, I’ll be going in-depth about every single one!
Sensor Network
So at it’s core, the PiPlanter is a Sensor Network & Pump System. Here’s a video explaining the sensor array:
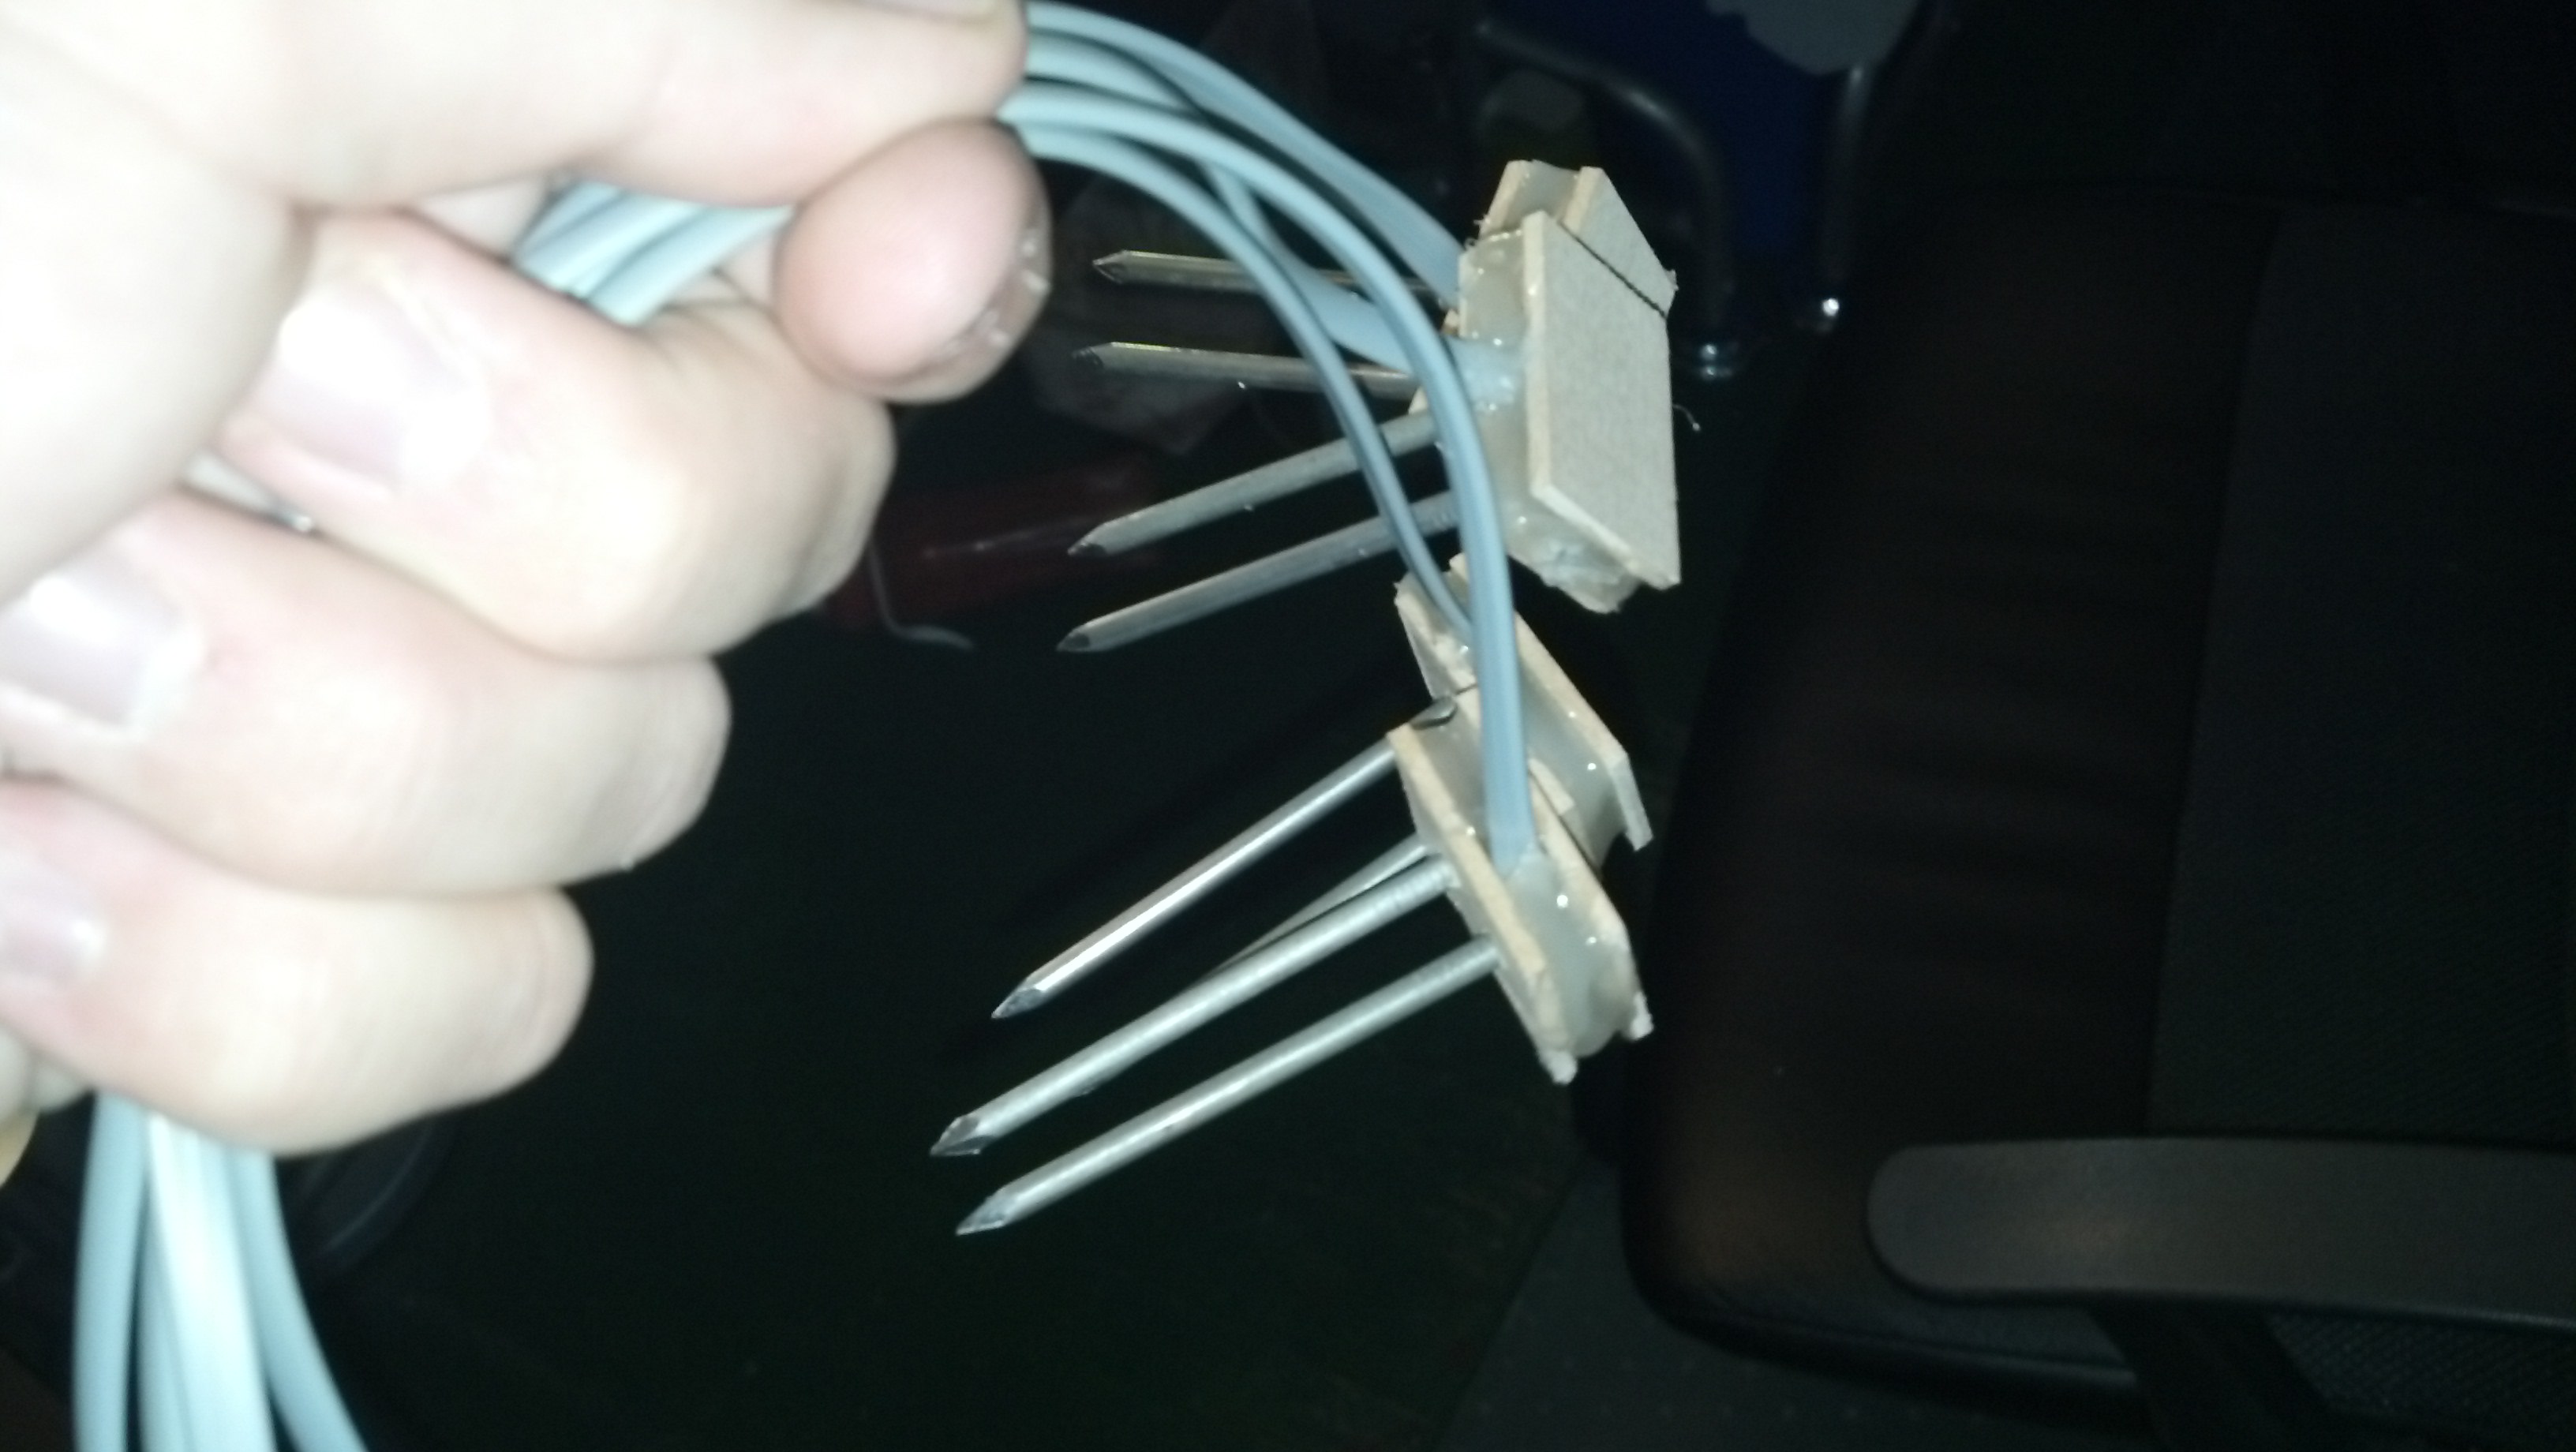
This project uses a TMP35-37 sensor to get a pretty precise temperature reading of the room. Later down in this post you can find out the algorithm to determine the temperature in Fahrenheit. It also uses a basic LDR to get the relative ambient light level in the room. Along with those two sensors, there are 4 relative humidity sensors of my own design, here’s a picture of them as seen in this post:
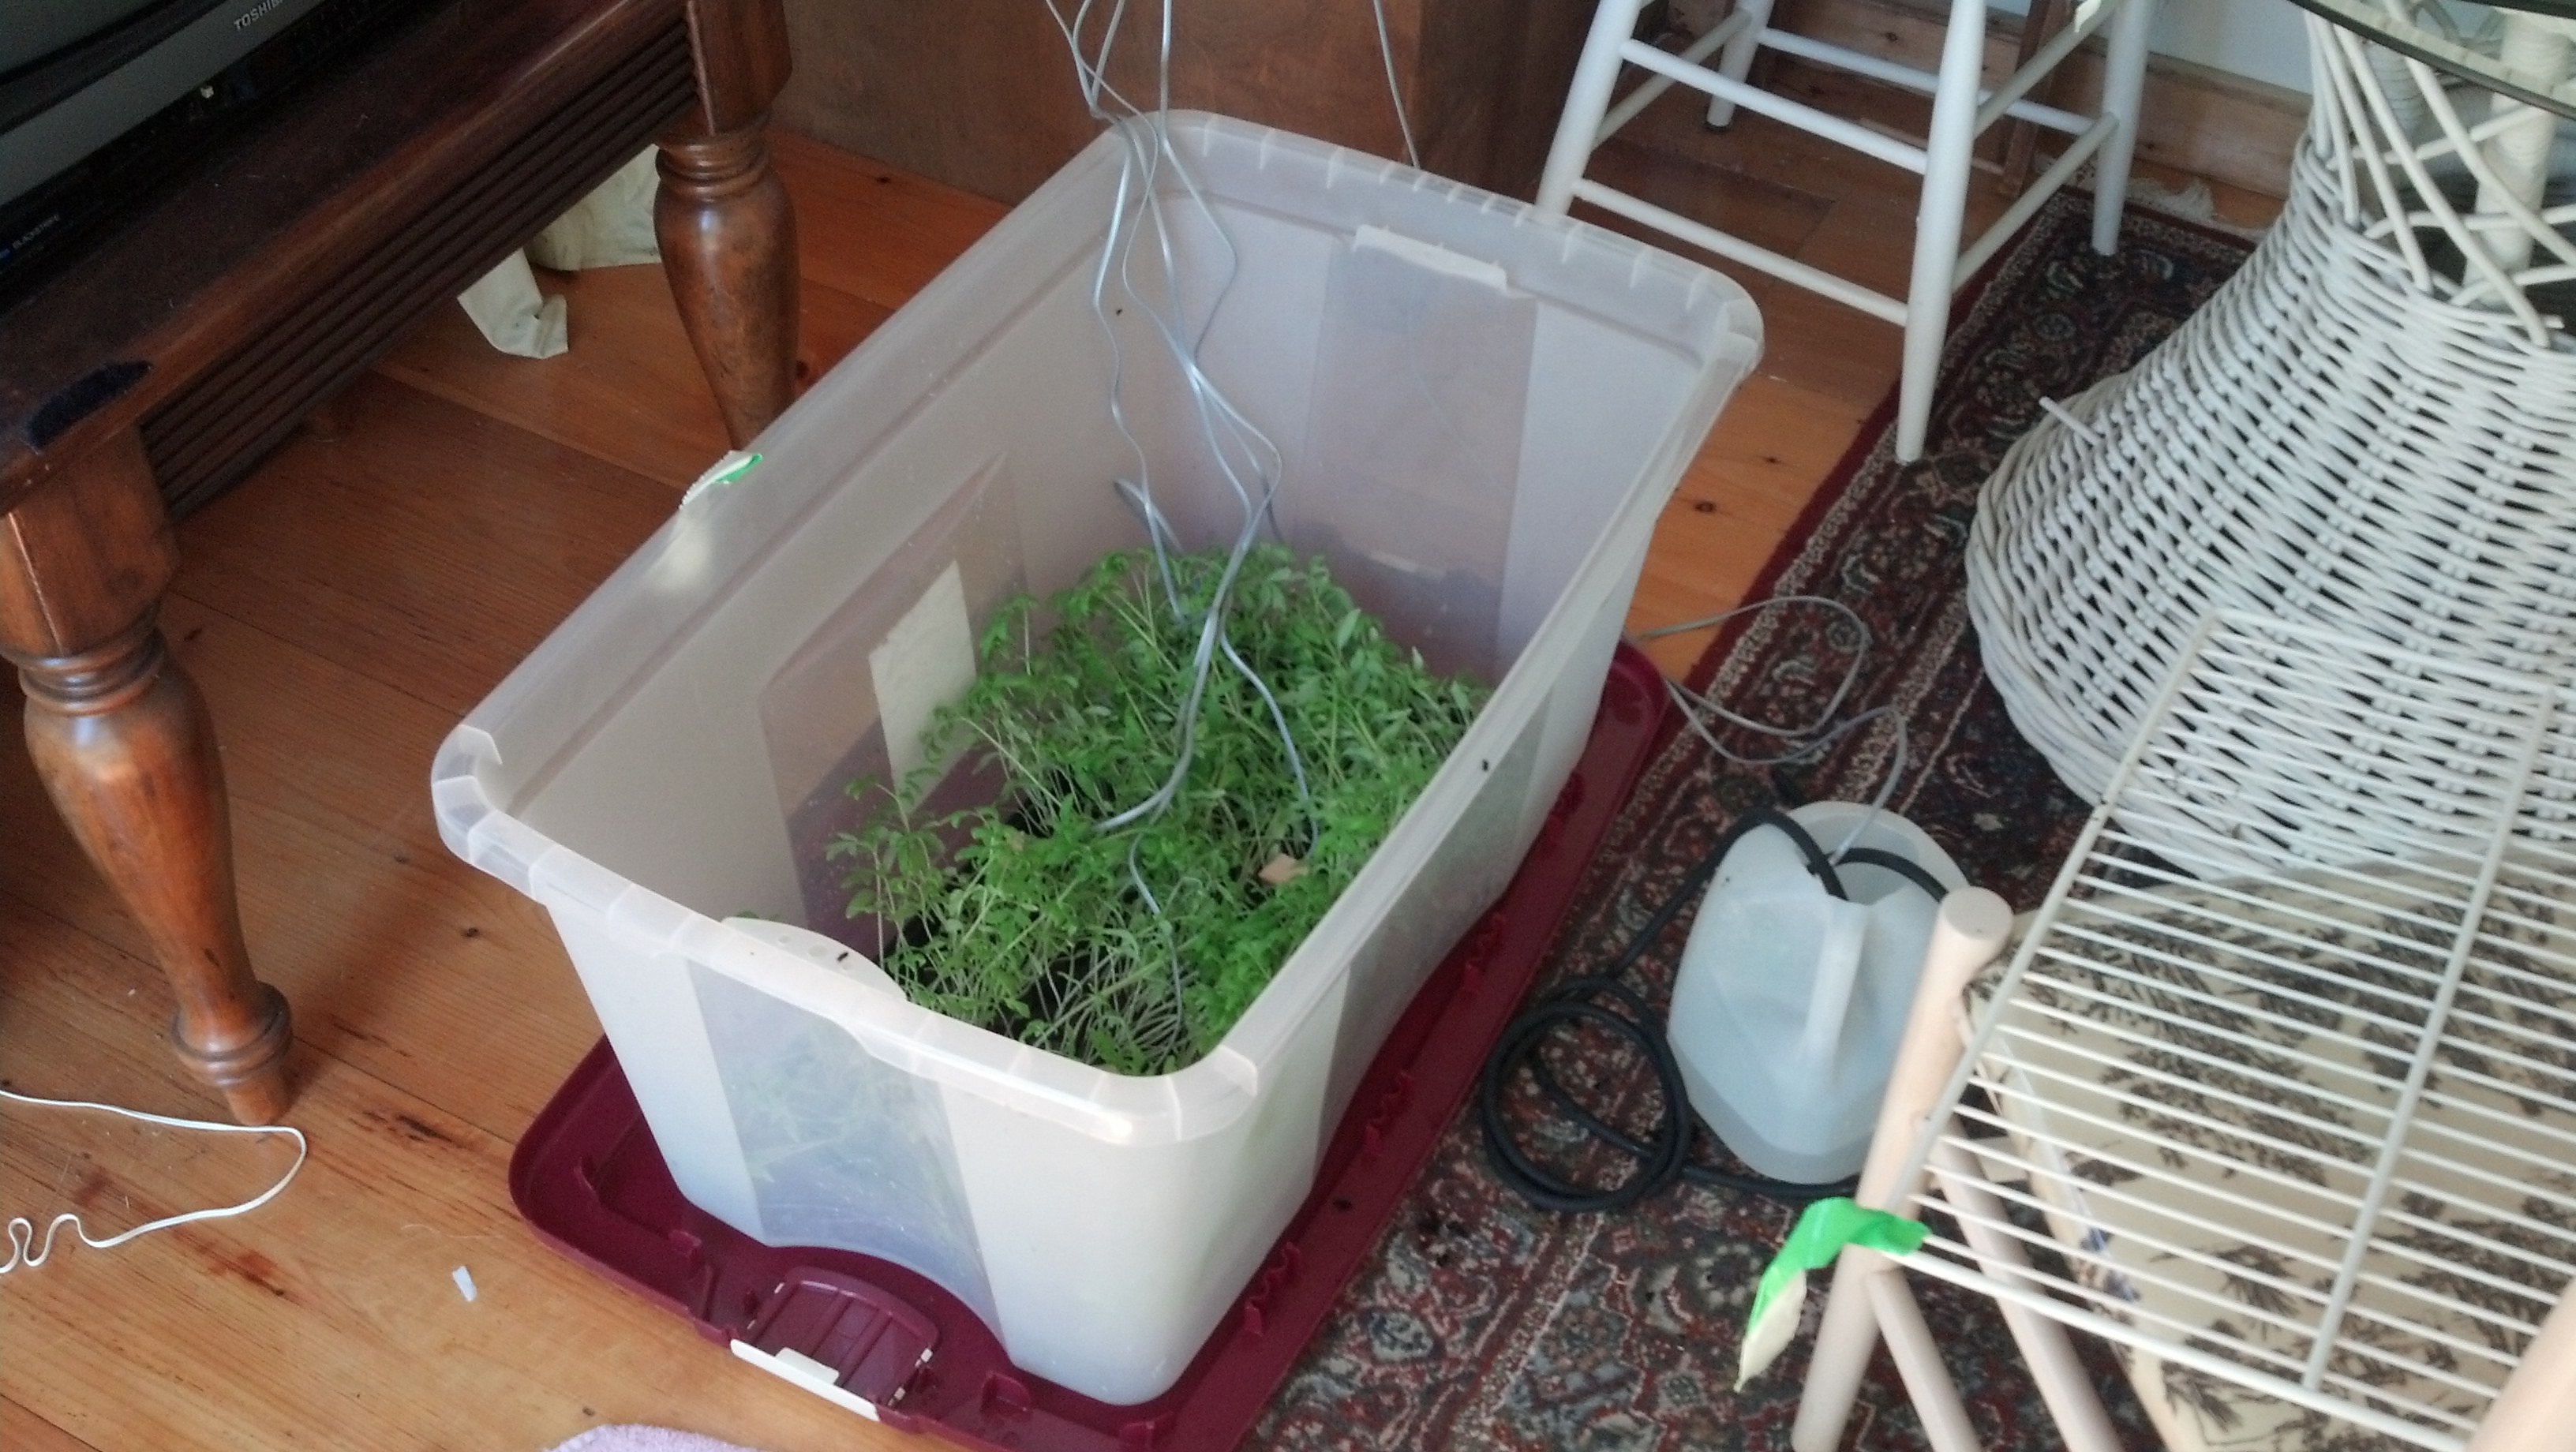
They’re hooked up to the ADC (mentioned later) in the same way that the LDR is, with a voltage dividing resistor, and then fed directly into ADC. The principal behind this sensor is that when you insert it into soil, the water in that soil connected the two probes, causing a voltage to flow across them. So if there is more water in the soil, more electrons will flow across them, and the analog value will be higher. It’s very basic, but it works. I’ve done several long term tests, and over time, as the soil becomes dryer, the value gets lower, indicating relative dryness. Here is a picture of the four probes in the soil, with the plants.
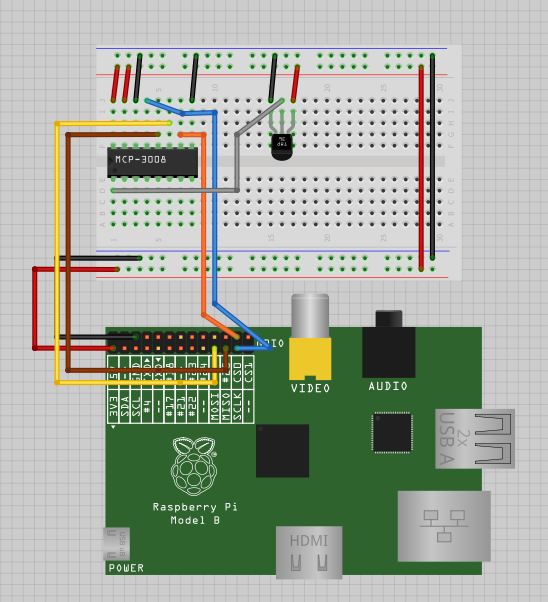
The TMP sensor’s output is plugged directly into the ADC and the LDR is very basically connected to the ADC as well, this is essentially how how the whole thing is setup on the breadboard:
Pump System
The pump system is pretty dead simple. Essentially it is a PowerSwitch Tail II switching the mains to a 9v DC power supply. The 9v power supply is connected directly to a 12v DC submersible pump. Instead of using a motor driver chip, which requires 3 pins to do, and the chip would get hot and whatnot, I’ve decided to go with this method.
The pump is not self priming. This means it cannot make the transition from pumping air to pumping water. I wrestled with this problem for a long time, and came up with what I think is an elegant solution. I submerged the pump directly into the water, which means the pump will never fill with air, and will always pump water when activated. Here’s a video explaining the pump system:
Raspberry Pi ADC
The next system is the ADC connected to the Raspberry Pi. It is an 8 bit, 8 port analog to digital converter that can easily run on 3.3v so it’s perfect for the pi. Here is the chip, and you set it up as follows (I took this from an earlier post I wrote)
Now we need to set up the specific libraries for python the first of which being spidev, the spi tool for the raspberry pi which we can grab from git using the following commands:
Shell
1
2
3
4
5
sudo apt-getinstall git
git clonegit://github.com/doceme/py-spidev
cdpy-spidev/
sudo apt-getinstall python-dev
sudo python setup.pyinstall
You also need to (copied from http://scruss.com/blog/2013/01/19/the-quite-rubbish-clock/):
As root, edit the kernel module blacklist file:
Shell
1
sudo vi/etc/modprobe.d/raspi-blacklist.conf
Comment out the spi-bcm2708 line so it looks like this:
Shell
1
#blacklist spi-bcm2708
Save the file so that the module will load on future reboots. To enable the module now, enter:
Shell
1
sudo modprobe spi-bcm2708
To read from the ADC, add the following to your python code. The full code will be listed later:
Python
1
2
3
4
5
6
7
8
#fuction that can read the adc
defreadadc(adcnum):
# read SPI data from MCP3008 chip, 8 possible adc's (0 thru 7)
ifadcnum>7oradcnum<0:
return-1
r=spi.xfer2([1,8+adcnum<<4,0])
adcout=((r[1]&3)<<8)+r[2]
returnadcout
So just use “readadc(n)” to get a value.
Python Code
I’ve made a real effort this time to comment my code well, so I’m not going to do a line by line breakdown like I often do, but I will clearly state the installs and setup things as follows. I’m assuming you have python-dev installed.
Download and install: APScheduler, this is a very straight forward install
Download and install: tweepy, you will need to go through the API setup process.
Download and install: flickrapi, you will need to go through the API setup process.
Here’s the source code for the python component of this project:
Python
1
2
3
4
5
6
7
8
9
10
11
12
13
14
15
16
17
18
19
20
21
22
23
24
25
26
27
28
29
30
31
32
33
34
35
36
37
38
39
40
41
42
43
44
45
46
47
48
49
50
51
52
53
54
55
56
57
58
59
60
61
62
63
64
65
66
67
68
69
70
71
72
73
74
75
76
77
78
79
80
81
82
83
84
85
86
87
88
89
90
91
92
93
94
95
96
97
98
99
100
101
102
103
104
105
106
107
108
109
110
111
112
113
114
115
116
117
118
119
120
121
122
123
124
125
126
127
128
129
130
131
132
133
134
135
136
137
138
139
140
141
142
143
144
145
146
147
148
149
150
151
152
153
154
155
156
157
158
159
160
161
162
163
164
165
166
167
168
169
170
171
172
173
174
175
176
177
178
179
180
181
182
183
184
185
#Timing setup
fromdatetimeimportdatetime
fromapscheduler.scheduler importScheduler
importtime
importdatetime
importsys
importos
now=datetime.datetime.now()
#import logging #if you start getting logging errors, uncomment these two lines
#logging.basicConfig()
#GPIO setup
importRPi.GPIO asGPIO
GPIO.setmode(GPIO.BOARD)
GPIO.cleanup()
pin=26#pin for the adc
GPIO.setup(pin,GPIO.OUT)
NPNtrans=3#the pin for the npn transistor
GPIO.setup(NPNtrans,GPIO.OUT)
sampleLED=5#the indicator LED
GPIO.setup(sampleLED,GPIO.OUT)
pump=7#pin for the pump
GPIO.setup(pump,GPIO.OUT)
#the adc's SPI setup
importspidev
spi=spidev.SpiDev()
spi.open(0,0)
#sets up the program's ability to write to a mysql database
ifnottoken:raw_input("Press ENTER after you authorized this program")
flickr.get_token_part_two((token,frob))
#Variable Setup
ontime=20
#fuction that can read the adc
defreadadc(adcnum):
# read SPI data from MCP3008 chip, 8 possible adc's (0 thru 7)
ifadcnum>7oradcnum<0:
return-1
r=spi.xfer2([1,8+adcnum<<4,0])
adcout=((r[1]&3)<<8)+r[2]
returnadcout
defslowSample():
date0="21-06-2013 15"
date1="25-06-2013 12"
date2="29-06-2013 12"
date3="04-07-2013 12"
date4="06-07-2013 12"
ifstr(time.strftime('%d-%m-%Y %H'))==date0:
water()
ifstr(time.strftime('%d-%m-%Y %H'))==date1:
water()
ifstr(time.strftime('%d-%m-%Y %H'))==date2:
water()
ifstr(time.strftime('%d-%m-%Y %H'))==date3:
water()
ifstr(time.strftime('%d-%m-%Y %H'))==date4:
water()
print"----------start----------"
GPIO.output(NPNtrans,True)
GPIO.output(sampleLED,True)
time.sleep(1)
sampleTime=time.ctime()
mst1=readadc(0)
mst2=readadc(1)
mst3=readadc(2)
mst4=readadc(3)
pot1=readadc(4)
ldr1=readadc(5)
millivolts=readadc(6)*(3300.0/1024.0)
temp_c=((millivolts-100.0)/10)-40.0
tmp1=(temp_c*9.0/5.0)+32
#prints debug info to console
printsampleTime,"|","MST1:",mst1,"MST2:",mst2,"MST3:",mst3,"MST4:",mst4,"Pot1:",pot1,"LDR1:",ldr1,"TMP1:",tmp1#prints the debug info
#adds the data to the mysql table
cursor.execute("INSERT INTO piplanter_table_17(Time,mst1_V,mst2_V,mst3_V,mst4_V,pot1_V,ldr1_V,tmp1_F) VALUES(%s,%s,%s,%s,%s,%s,%s,%s)",(sampleTime,mst1,mst2,mst3,mst4,pot1,ldr1,tmp1))
con.commit()#this is important for live updating
GPIO.output(NPNtrans,False)#turns the probes off
#renders the image of the graph
print"render start"
os.system("php /opt/bitnami/apps/wordpress/htdocs/piplanter/renderScript.php")#renders the .png file
slowSample()#runs the sample once before the interval starts, mostly a debug function
scheduler=Scheduler(standalone=True)
scheduler.add_interval_job(slowSample,hours=1)
scheduler.start()#runs the program indefianately once every hour
There you go! Essentially, every hour, the raspberry pi samples data from 4 humidity probes, an LDR and a tmp sensor. Once the sampling is complete, it dumps the data into a mysql database. From there the data is rendered into a graph using pChart in the form of a .png image. From there, that .png files is uploaded to flickr using this api. Once the file is uploaded, it returns it’s photo ID to the python script. From there, a tweet is built containing the brightness at the time of the tweet, the temperature at the time of the tweet, and the average moisture of the plants. It also uses the photo ID from flickr obtained earlier to build a URL leading to that image on flickr which it tweets as well. The final part of the tweet is a url that leads to this post! (taken from)
MySQL Database
The database is extremely simple, after installing MySQL set it up and create table that follows this syntax:
Pretty basic stuff, the table is just where the python script dumps the data every hour.
PChart Graph
The software driving the graphing part of the project is a bit of php graphing software called pchart. It allows me to graph mysql values from a table in a variety of ways. It is very important, and the code for the php script is as follows:
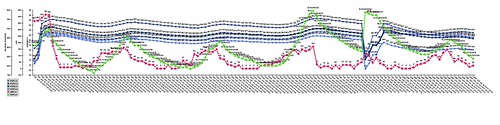
As you may be able to guess, upon the calling of this script, the program looks for a table called “piplanter_table_17” and does a bunch of stuff as commented to produce a graph. This is what a sample graph looks like:
This is data taken over 6 days, and it’s a lot to look at, but it’s good stuff.
Twitter & Flickr Integration
As you hopefully derived from the python code, this project uses Twitter to send data to me. Instead of using an email server or sending sms messages, I decided on twitter because of a few reasons. I use the service constantly, so I won’t ever miss a tweet. The API seemed really easy to use (and it was!) and allowed more than one person to acess the data at any one time. I decided to use flickr as my image hosting service for a lot of the same reasons, but the main one was their 1TB storage per person. You’ve already seen a sample flickr upload, so here’s a sample tweet:
That’s essentially it! Thank you for reading, and please ask questions.
Hey! This post was written a long time ago, but I'm leaving it up on the off-chance it may help someone. Proceed with caution. It may not be a good idea to blindly integrate this code or work into your project, but instead use it as a starting point.
Last night I finished the majority of the software for this project. Here’s a video of me going over what happened and what the program does in simpler terms:
Essentially, every hour, the raspberry pi samples data from 4 humidity probes, an LDR and a tmp sensor. Once the sampling is complete, it dumps the data into a mysql database. From there the data is rendered into a graph using pChart in the form of a .png image. From there, that .png files is uploaded to flickr using this api. Once the file is uploaded, it returns it’s photo ID to the python script. From there, a tweet is built containing the brightness at the time of the tweet, the temperature at the time of the tweet, and the average moisture of the plants. It also uses the photo ID from flickr obtained earlier to build a URL leading to that image on flickr which it tweets as well. The final part of the tweet is a url that leads to this post!
That was a lot of explanation, but this program does quite a bit. The source comes in two parts, here’s the python script that handles the brunt of the processing. You will need a bunch of libraries to run this, you could pick through past posts of mine to find what those are, but when I do a final post for this project I will include all of those.
Python
1
2
3
4
5
6
7
8
9
10
11
12
13
14
15
16
17
18
19
20
21
22
23
24
25
26
27
28
29
30
31
32
33
34
35
36
37
38
39
40
41
42
43
44
45
46
47
48
49
50
51
52
53
54
55
56
57
58
59
60
61
62
63
64
65
66
67
68
69
70
71
72
73
74
75
76
77
78
79
80
81
82
83
84
85
86
87
88
89
90
91
92
93
94
95
96
97
98
99
100
101
102
103
104
105
106
107
108
109
110
111
112
113
114
115
116
117
118
119
120
121
122
123
124
125
126
127
#Timing setup
fromdatetimeimportdatetime
fromapscheduler.scheduler importScheduler
importtime
importdatetime
importsys
importos
now=datetime.datetime.now()
importlogging#if you start getting logging errors, uncomment these two lines
logging.basicConfig()
#GPIO setup
importRPi.GPIO asGPIO
GPIO.setmode(GPIO.BOARD)
GPIO.cleanup()
pin=26#pin for the adc
GPIO.setup(pin,GPIO.OUT)
NPNtrans=3#the pin for the npn transistor
GPIO.setup(NPNtrans,GPIO.OUT)
sampleLED=5#the indicator LED
GPIO.setup(sampleLED,GPIO.OUT)
#the adc's SPI setup
importspidev
spi=spidev.SpiDev()
spi.open(0,0)
#sets up the program's ability to write to a mysql database
ifnottoken:raw_input("Press ENTER after you authorized this program")
flickr.get_token_part_two((token,frob))
#fuction that can read the adc
defreadadc(adcnum):
# read SPI data from MCP3008 chip, 8 possible adc's (0 thru 7)
ifadcnum>7oradcnum<0:
return-1
r=spi.xfer2([1,8+adcnum<<4,0])
adcout=((r[1]&3)<<8)+r[2]
returnadcout
defslowSample():
GPIO.output(NPNtrans,True)
GPIO.output(sampleLED,True)
sampleTime=time.ctime()
mst1=readadc(0)
mst2=readadc(1)
mst3=readadc(2)
mst4=readadc(3)
pot1=readadc(4)
ldr1=readadc(5)
millivolts=readadc(6)*(3300.0/1024.0)
temp_c=((millivolts-100.0)/10)-40.0
tmp1=(temp_c*9.0/5.0)+32
#prints debug info to console
printsampleTime,"|","MST1:",mst1,"MST2:",mst2,"MST3:",mst3,"MST4:",mst4,"Pot1:",pot1,"LDR1:",ldr1,"TMP1:",tmp1#prints the debug info
#adds the data to the mysql table
cursor.execute("INSERT INTO piplanter_table_15(Time,mst1_V,mst2_V,mst3_V,mst4_V,pot1_V,ldr1_V,tmp1_F) VALUES(%s,%s,%s,%s,%s,%s,%s,%s)",(sampleTime,mst1,mst2,mst3,mst4,pot1,ldr1,tmp1))
con.commit()#this is important for live updating
GPIO.output(NPNtrans,False)#turns the probes off
#renders the image of the graph
print"render start"
os.system("php /opt/bitnami/apps/wordpress/htdocs/piplanter/renderScript.php")#renders the .png file
Hey! This post was written a long time ago, but I'm leaving it up on the off-chance it may help someone. Proceed with caution. It may not be a good idea to blindly integrate this code or work into your project, but instead use it as a starting point.
It’s summer time and I just got a bunch of money for graduating so the next logical step is make a boom box.
I have already ordered the parts, so here’s my list and an explanation for each part:
Amp – This is the heart of the system. Essentially it’s a small amplifier that will run on 12v. According to the reviews it’s pretty loud. It will take a very standard 3.5mm audio input, or a dual channel analog signal which will be easy to build around.
Battery – Long time followers will know I have a pretty big charger that should be able handle charging this beast. It’s 12v, which is the amp runs on.
Speakers – I picked these mostly because if their compatibility with the amp, and their good reviews on amazon, and the fact that they come with a grill and mounting hardware.
Bluetooth Receiver – This is another “selling point” of the system. Users will play music over Bluetooth. It can be powered via 5v, and I have a spare switching regulator that I can use to power it.
Ammo Box Enclosure – This will house the project. It is big enough, and easy enough to cut into to mount the speakers into the side. It is also sealed, so getting sand in it won’t be that big of an issue for beach trips.
I’ll keep updating as parts come in.
Hey! This post was written a long time ago, but I'm leaving it up on the off-chance it may help someone. Proceed with caution. It may not be a good idea to blindly integrate this code or work into your project, but instead use it as a starting point.
Hey! This post was written a long time ago, but I'm leaving it up on the off-chance it may help someone. Proceed with caution. It may not be a good idea to blindly integrate this code or work into your project, but instead use it as a starting point.
I wanted to create a way to push data from my Raspberry Pi monitoring plant growth to myself. Instead of creating an email server and sending emails, or setting up an sms client, I decided to install tweepy and use twitter and python to send me the data.
First thing’s first, I had to create a dummy account (@eso_rpi) and sign up for the Twitter Dev Program, which is a free way to access the API. You will need to generate a set of consumer keys and access tokens for your app. The process is pretty simple, and the tweepy example is pretty straight forward. If you run into trouble you could easily google it as the process is pretty well documented.
Here’s my code, you will need to download and install tweepy and apscheduler for this to work:
Python
1
2
3
4
5
6
7
8
9
10
11
12
13
14
15
16
17
18
19
20
21
22
23
24
25
26
27
28
29
30
31
32
33
34
35
36
37
38
39
40
41
42
43
44
45
46
47
48
49
50
51
52
53
54
55
#tweepy setup, you must use the keys given to you when you create your app
importtweepy
consumer_key=""
consumer_secret=""
access_token=""
access_token_secret=""
#APscheduler setup
fromdatetimeimportdatetime
fromapscheduler.scheduler importScheduler
importtime
importsys
importlogging#if you start getting logging errors, uncomment these two lines
logging.basicConfig()
#the adc's SPI setup
importspidev
spi=spidev.SpiDev()
spi.open(0,0)
#fuction that can read the adc
defreadadc(adcnum):
# read SPI data from MCP3008 chip, 8 possible adc's (0 thru 7)
The wiring diagram is the same as it is here, except there is an ldr connected to port 1:
There you go!
Hey! This post was written a long time ago, but I'm leaving it up on the off-chance it may help someone. Proceed with caution. It may not be a good idea to blindly integrate this code or work into your project, but instead use it as a starting point.
This post isn’t really thumbnail conducive but I tried!
I have been sleeping in too much. I would like an alarm clock that is easy to set and will play a random song to wake me up.
For a while I was using this program, but as you may be able to tell it requires an awful lot of user input, which isn’t ideal for a sleepy person as they may mess up (as I have, thus this post) but the “fire()” command works really well. To use this program you will need AP scheduler and MPG321 (sudo apt-get install mpg321)
But it wasn’t working. I wanted a way to re-purpose a service I use everyday (that way I wouldn’t have to modify my workflow) as an Alarm Clock. I landed on Google Calendar because I can add events from pretty much every device I interact with on a daily basis, and upon searching found out that developing using the python API wasn’t that hard at all.
To kick things off, you’ll need to download and install the Google Data Library.
I’ll be using this version. Unzip the .tar.gz and from the top top level directory it creates, install the setup.py file. Then run the tests/run_data_tests.py to see if it all works. Mine does fine but it if yours doesn’t, go through this guide written by google to get yourself up and running.
The brunt of this program comes down to a single boolean statement, but first we have to set that up. The API produces an rfc3339 time, and that’s a lot of irrelevant information for this application.
songfile=random.choice(os.listdir("/home/pi/alarmclock/test_MP3s/"))#chooses the .mp3 file
print"File Selected:",songfile
command="mpg321"+" "+"/home/pi/alarmclock/test_MP3s/"+"'"+songfile+"'"+" -g 100"#plays the MP3 in it's entierty. As long as the song is longer than a minute then will only trigger once in the minute that start of the "wake" event
printcommand
os.system(command)#runs the bash command
else:
print"Comparison:Fail"#the "wake" event's start time != the system's current time
defcallable_func():
os.system("clear")#this is more for my benefit and is in no way necesarry
scheduler.start()#runs the program indefinatly on an interval of 5 seconds
And there you have it! thanks for reading and leave me a comment if you have any questions/suggestions.
Hey! This post was written a long time ago, but I'm leaving it up on the off-chance it may help someone. Proceed with caution. It may not be a good idea to blindly integrate this code or work into your project, but instead use it as a starting point.