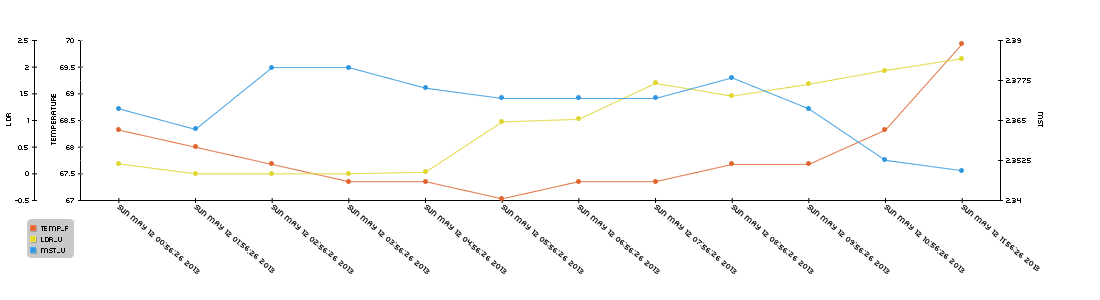
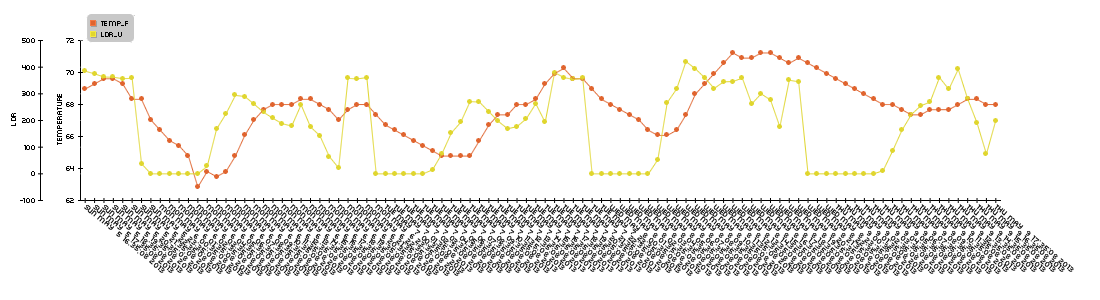
So as I said in one of my previous posts, I am going to be collecting a lot of data over the next few weeks while the tomato plants grow. I will be doing this to determine when soil is “dry” and how temperature and light effect that process. For the last week I have been collecting data in the configuration seen in my last post and here is the graph it produced you can click to see the full image:
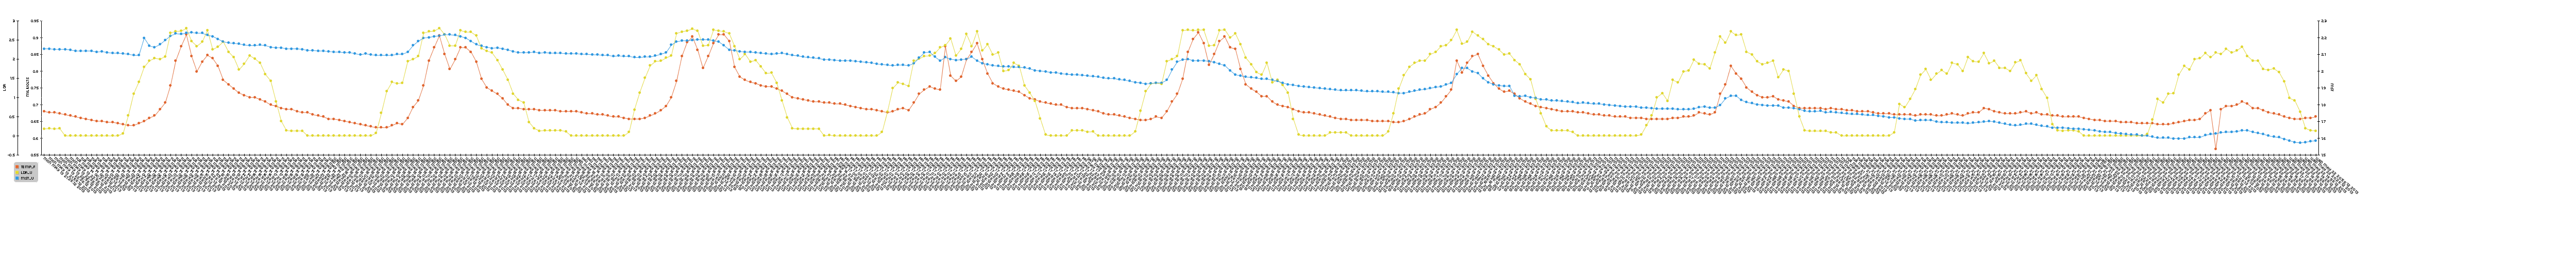
This graph proves a few things. The first thing is that the relative moisture sensor works. As one can intuitively understand, if you don’t add more water into the system, nature will remove water via evaporation. The overall trend of the blue line (the rel mst sensor) is downward, backing up this point.
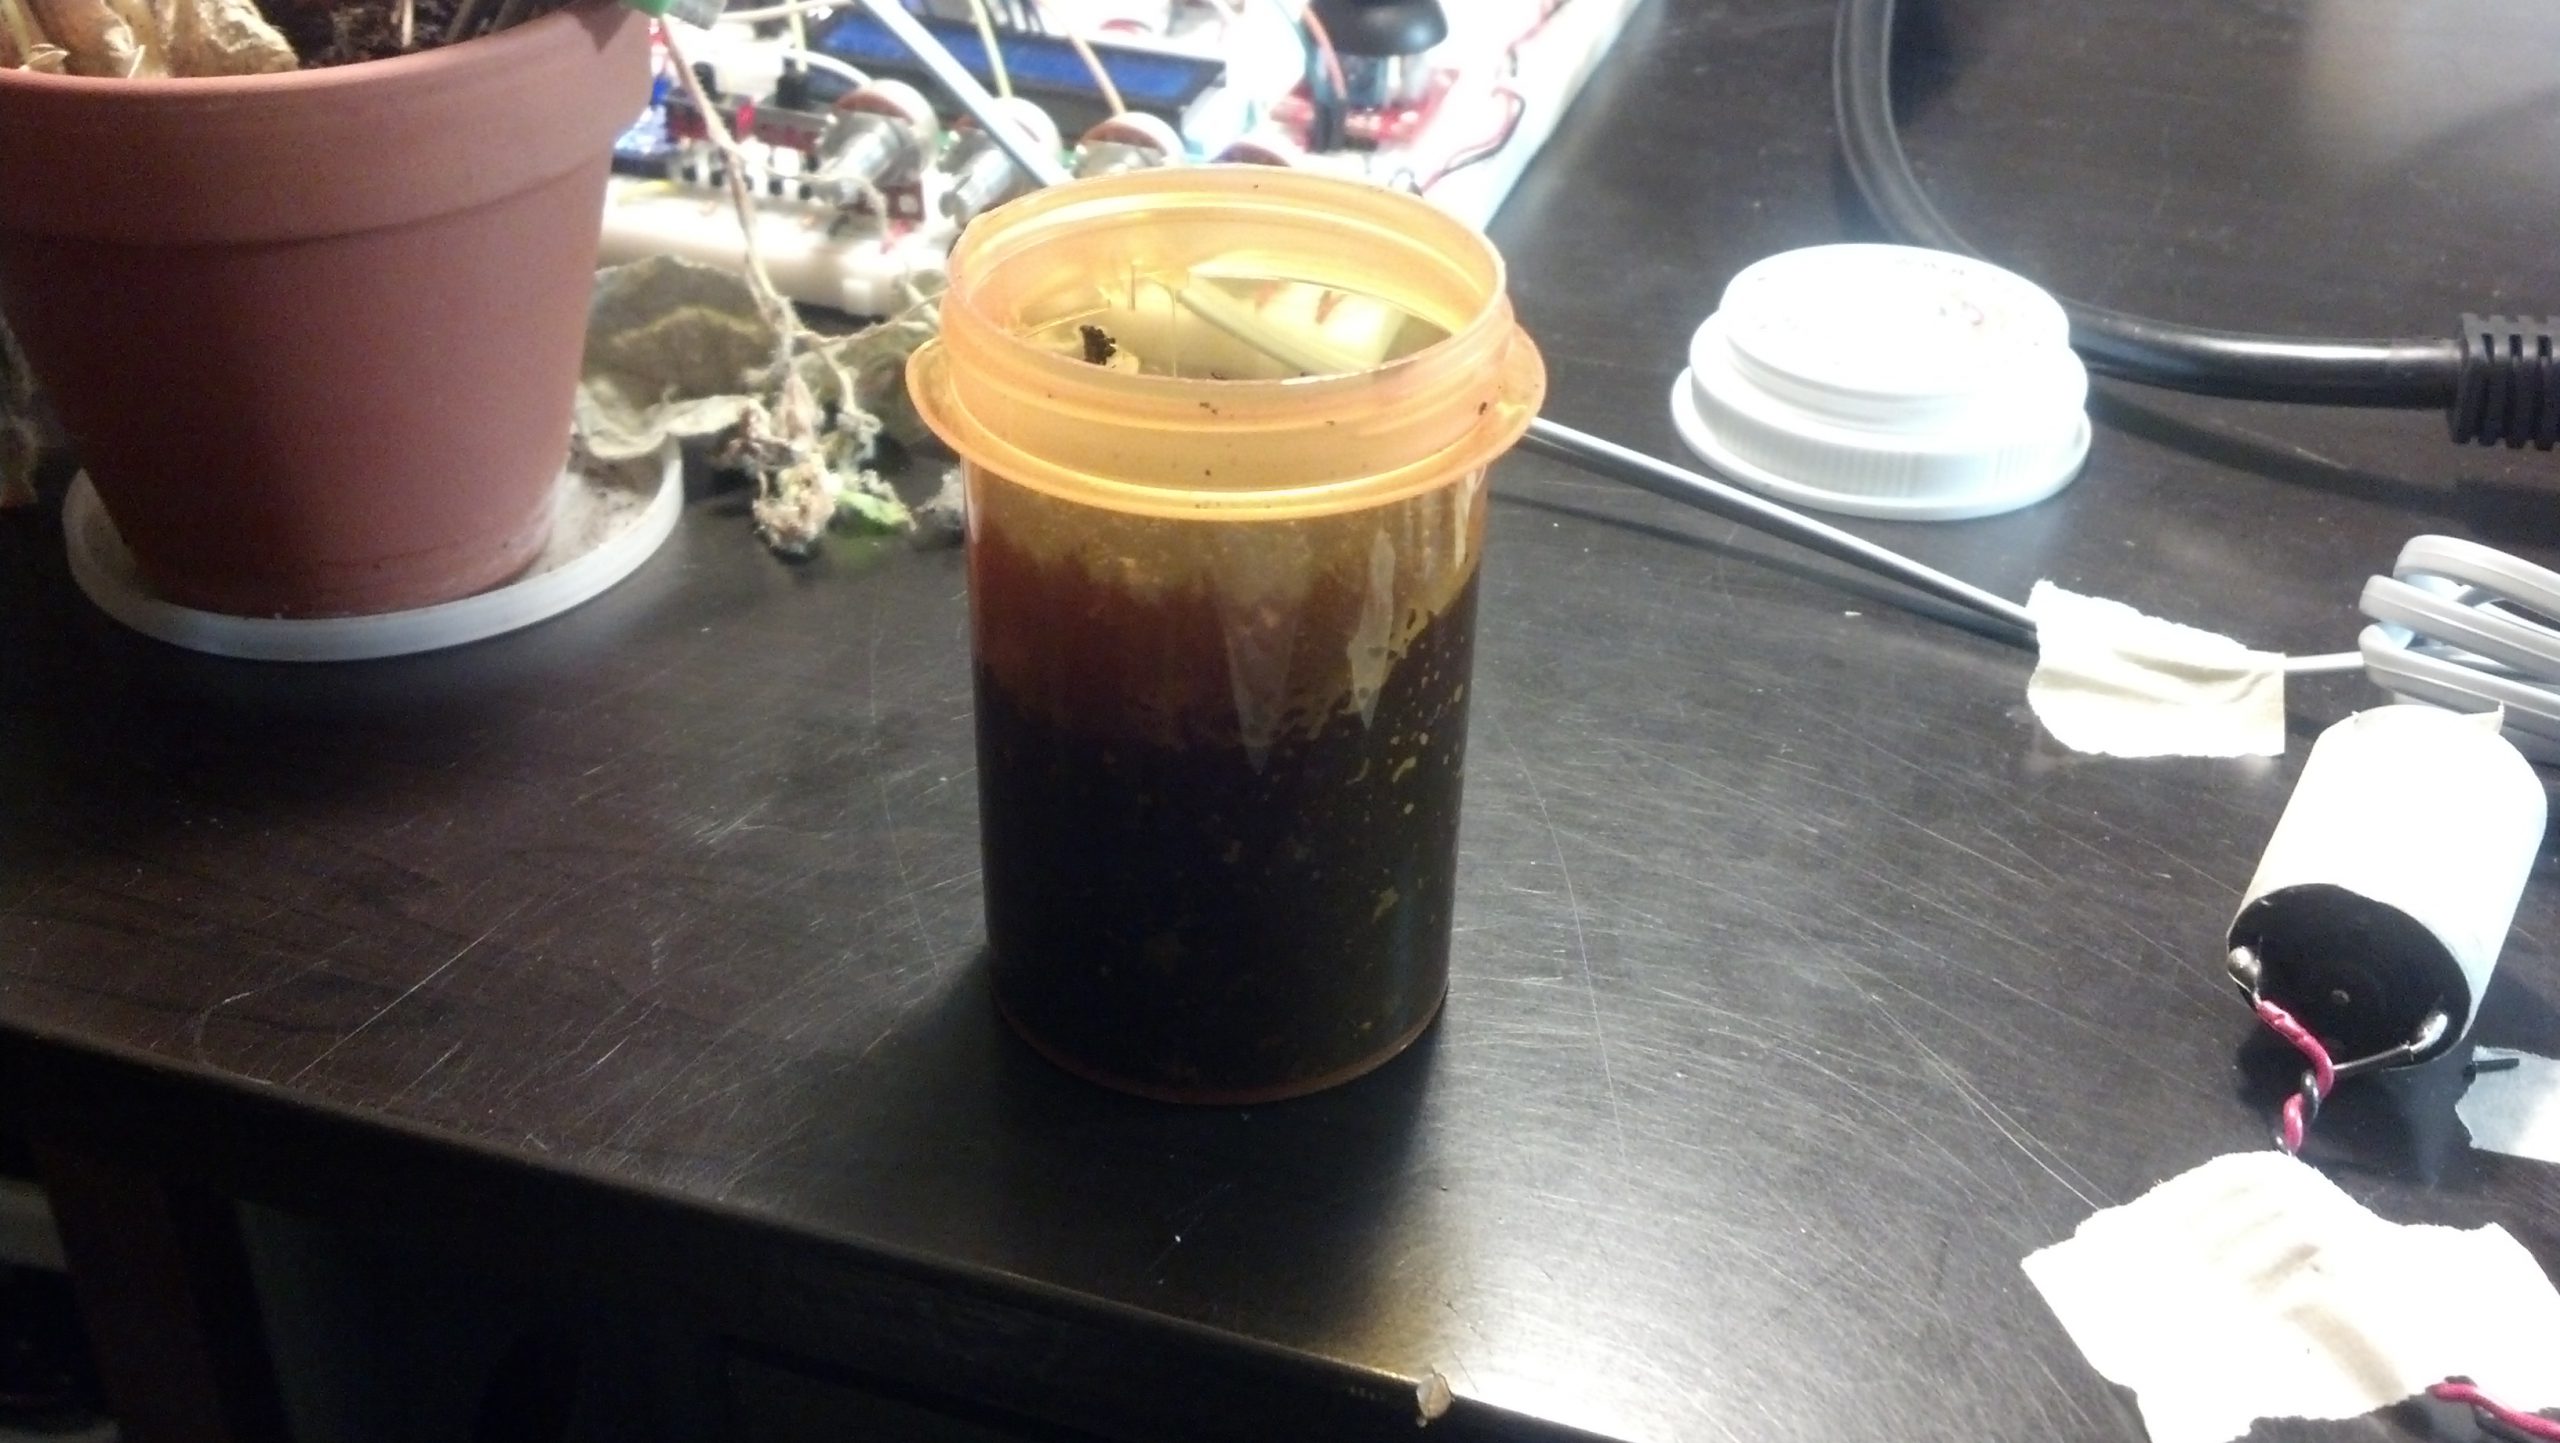
The problem with this setup was that I was spitting the voltage across the two probes constantly, which along with the water caused the nails to rapidly oxidize, which is something I would like to avoid in the long term. This also may have seriously corrupted the data so besides general trends, this whole set is unusable.
This isn’t necessarily a bad thing though, as I wanted to conduct a second trial with more probes and more dirt.
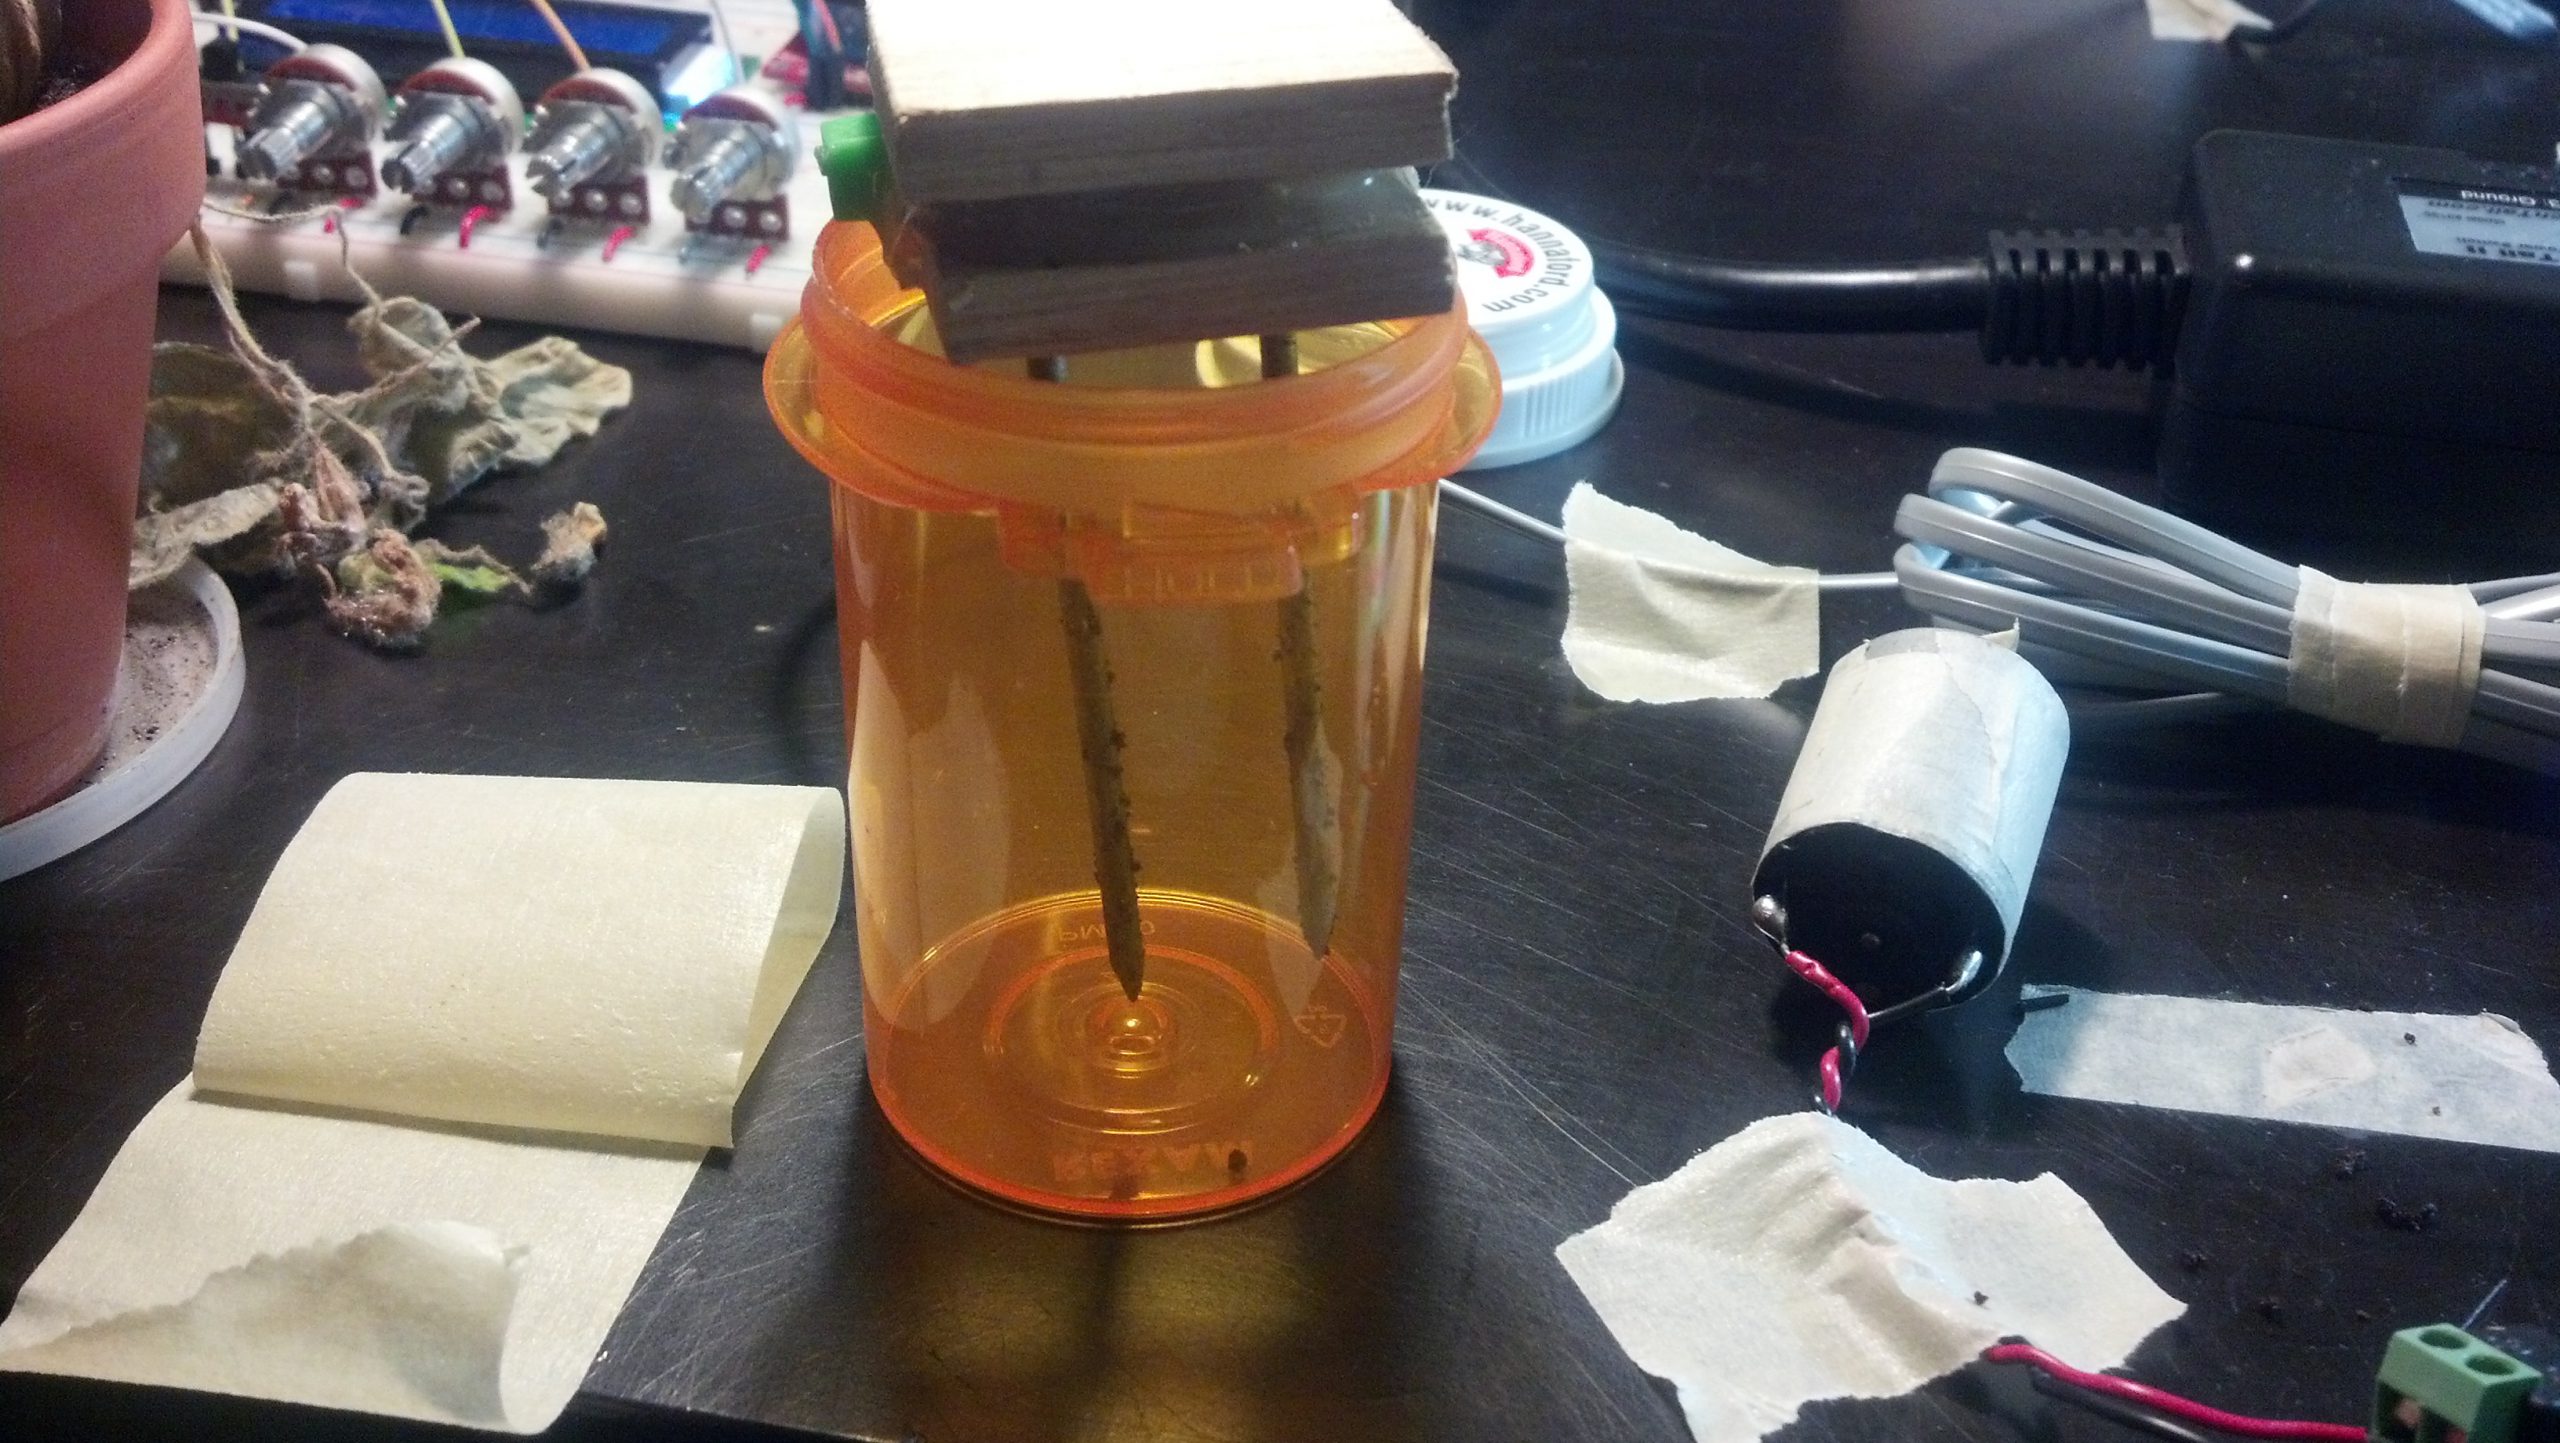
I decided to go with 4 probes, and here are a few pictures of the assembly process. Assembly process is the same, I just did it at my school:
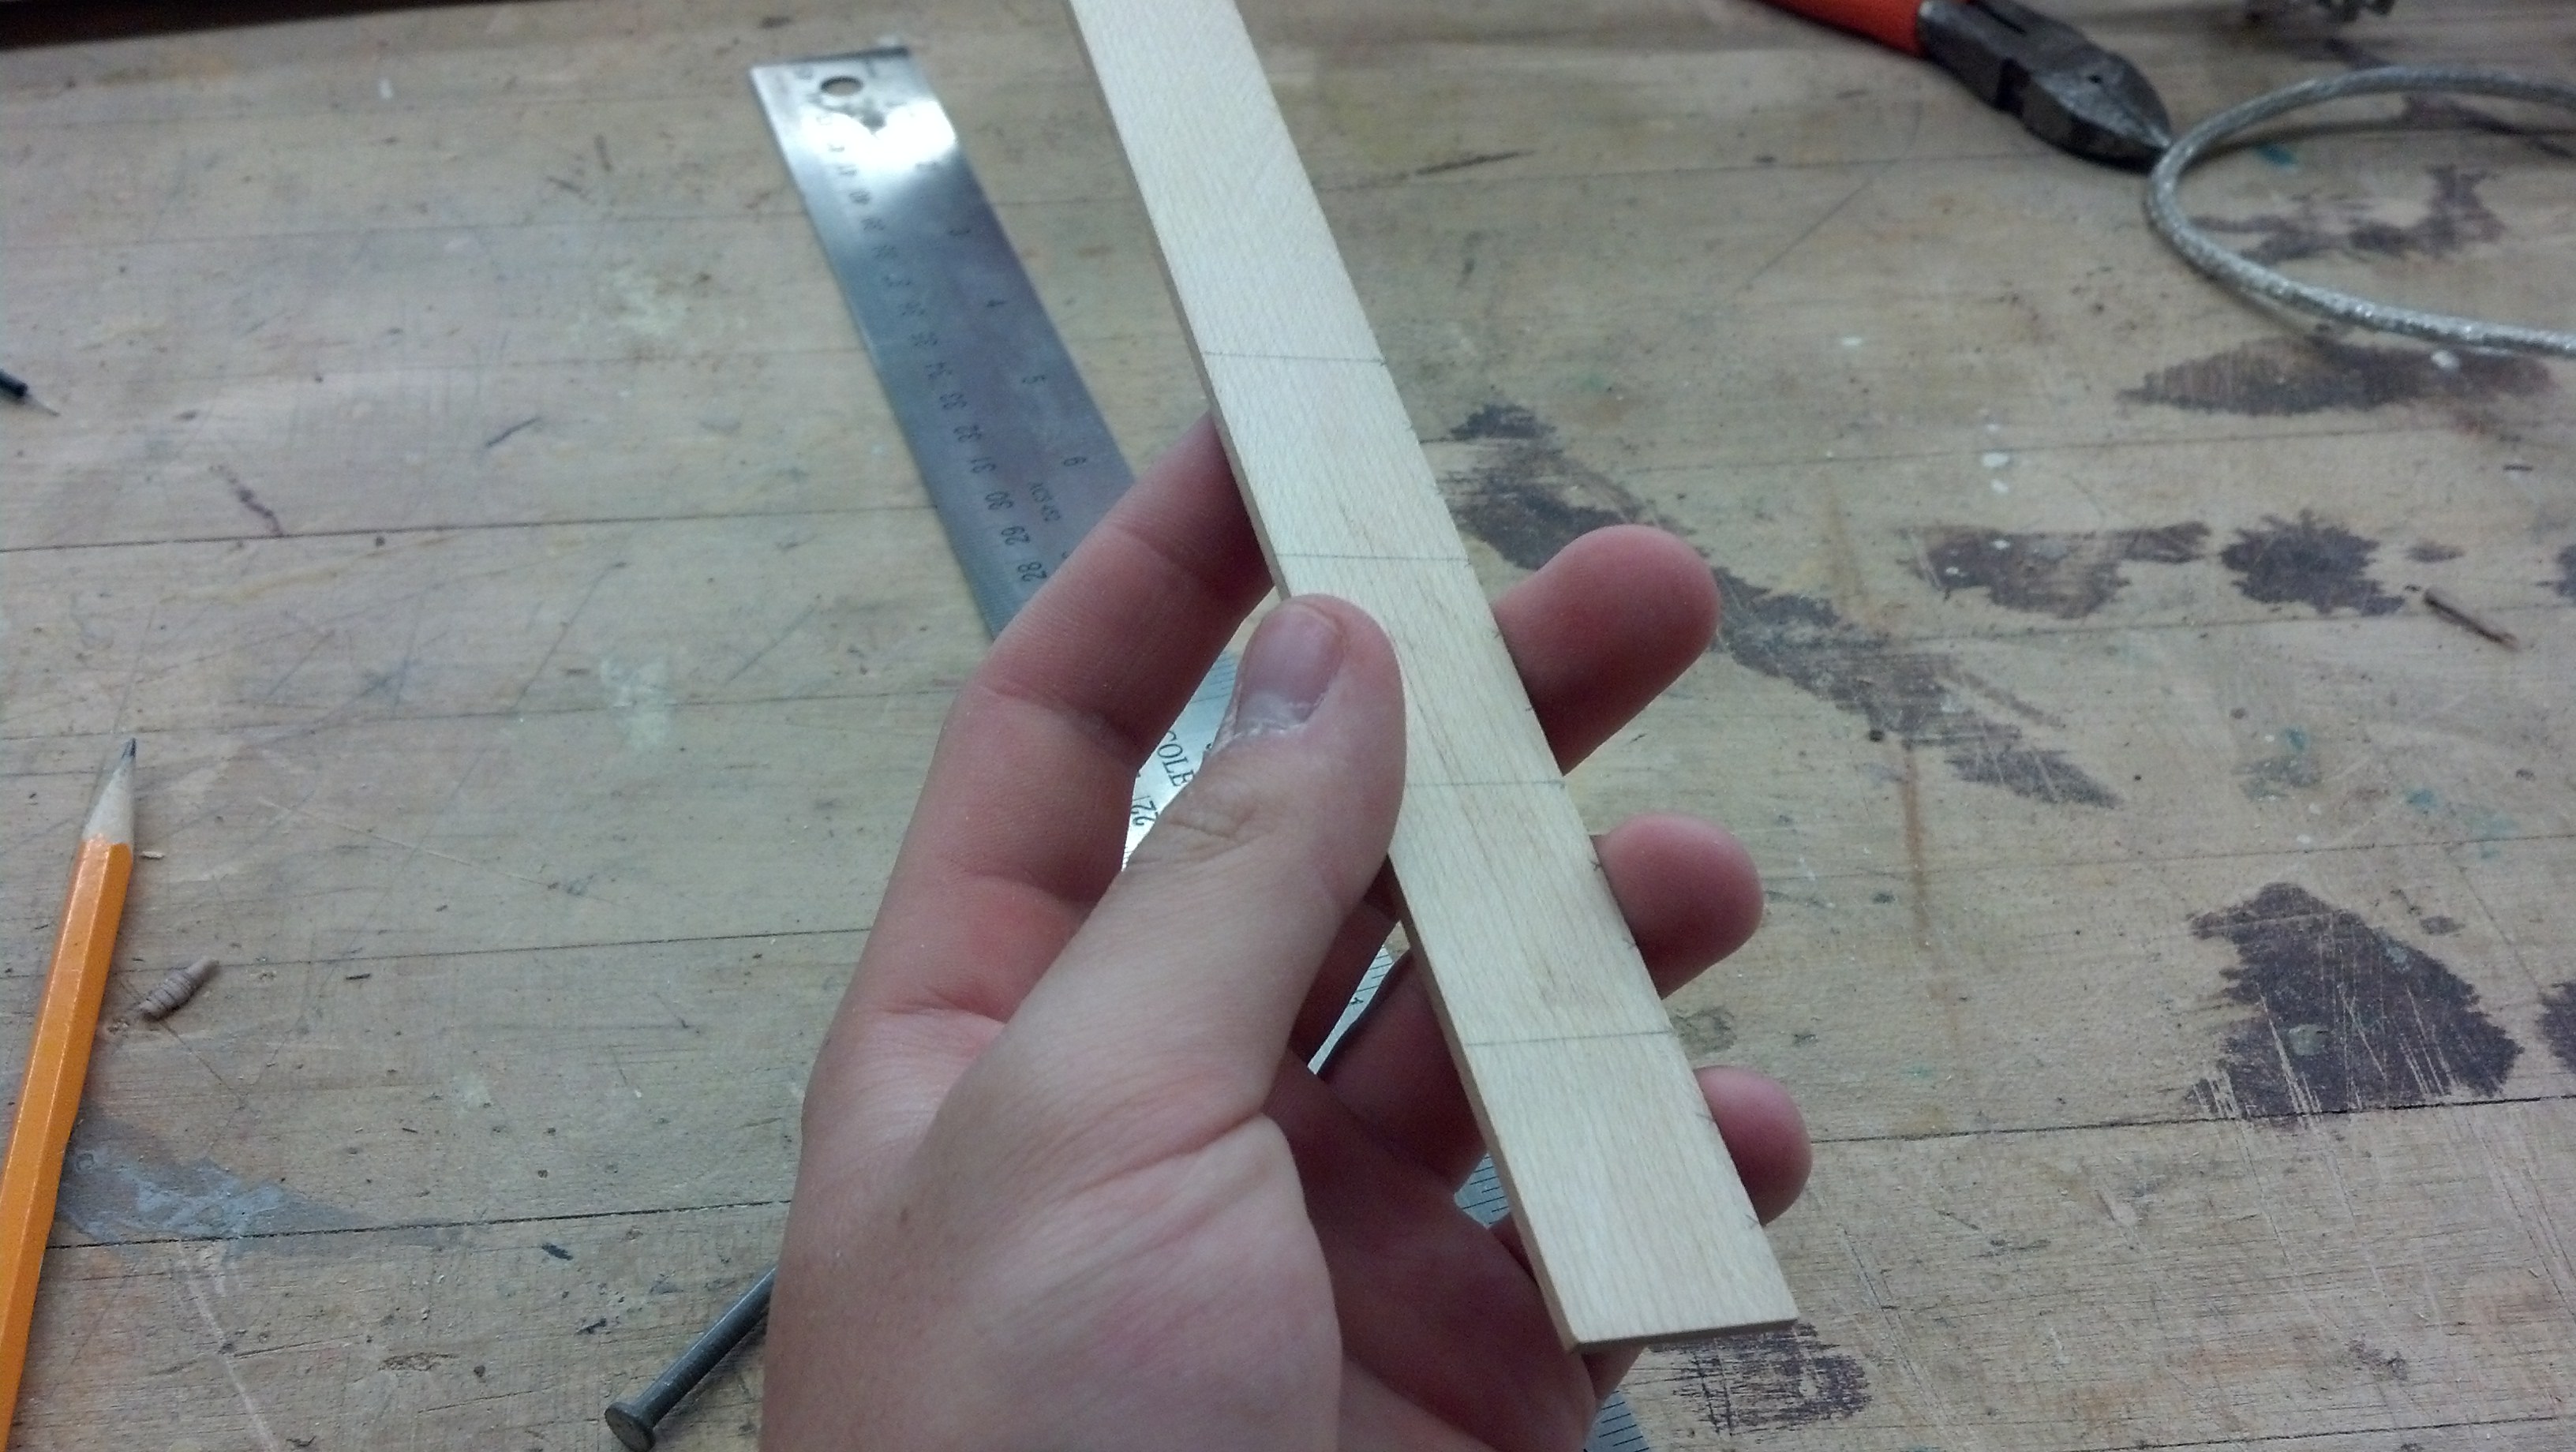
I cut it into 3cm sections and then drilled holes on the midpoints of the 2nd and 3rd cm as seen in a photo below.
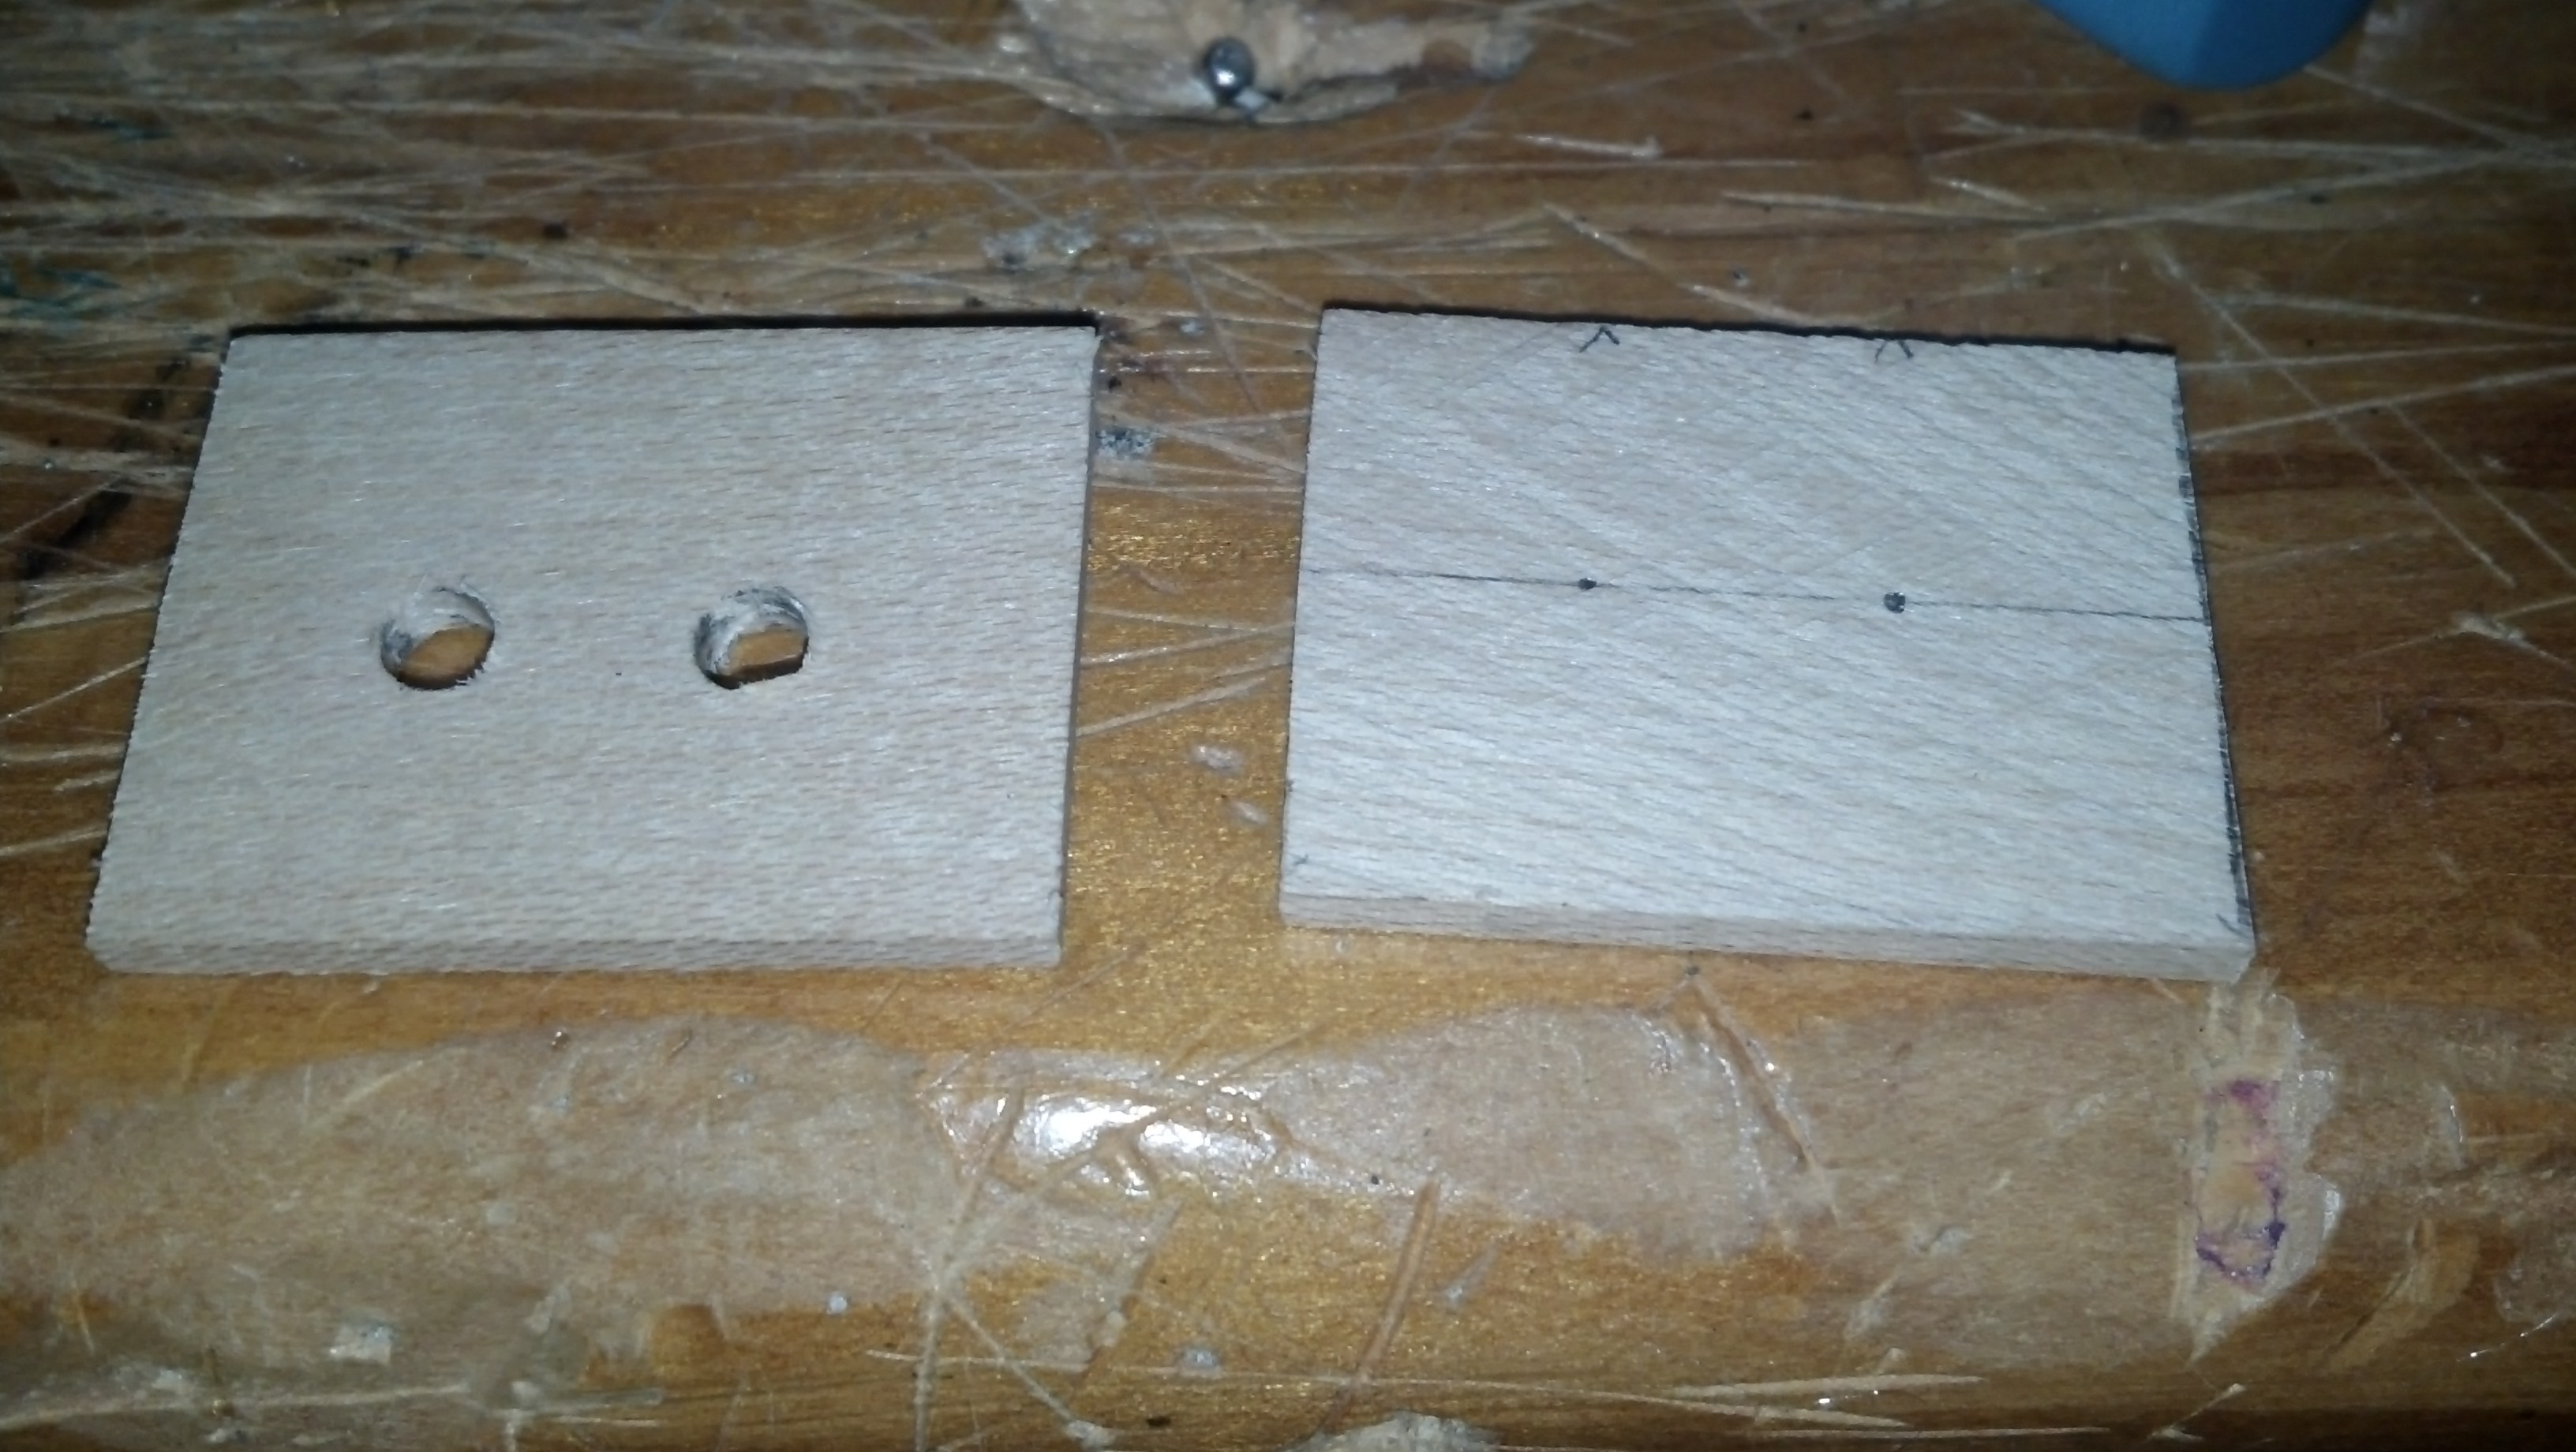
Here are the holes drilled for the nails

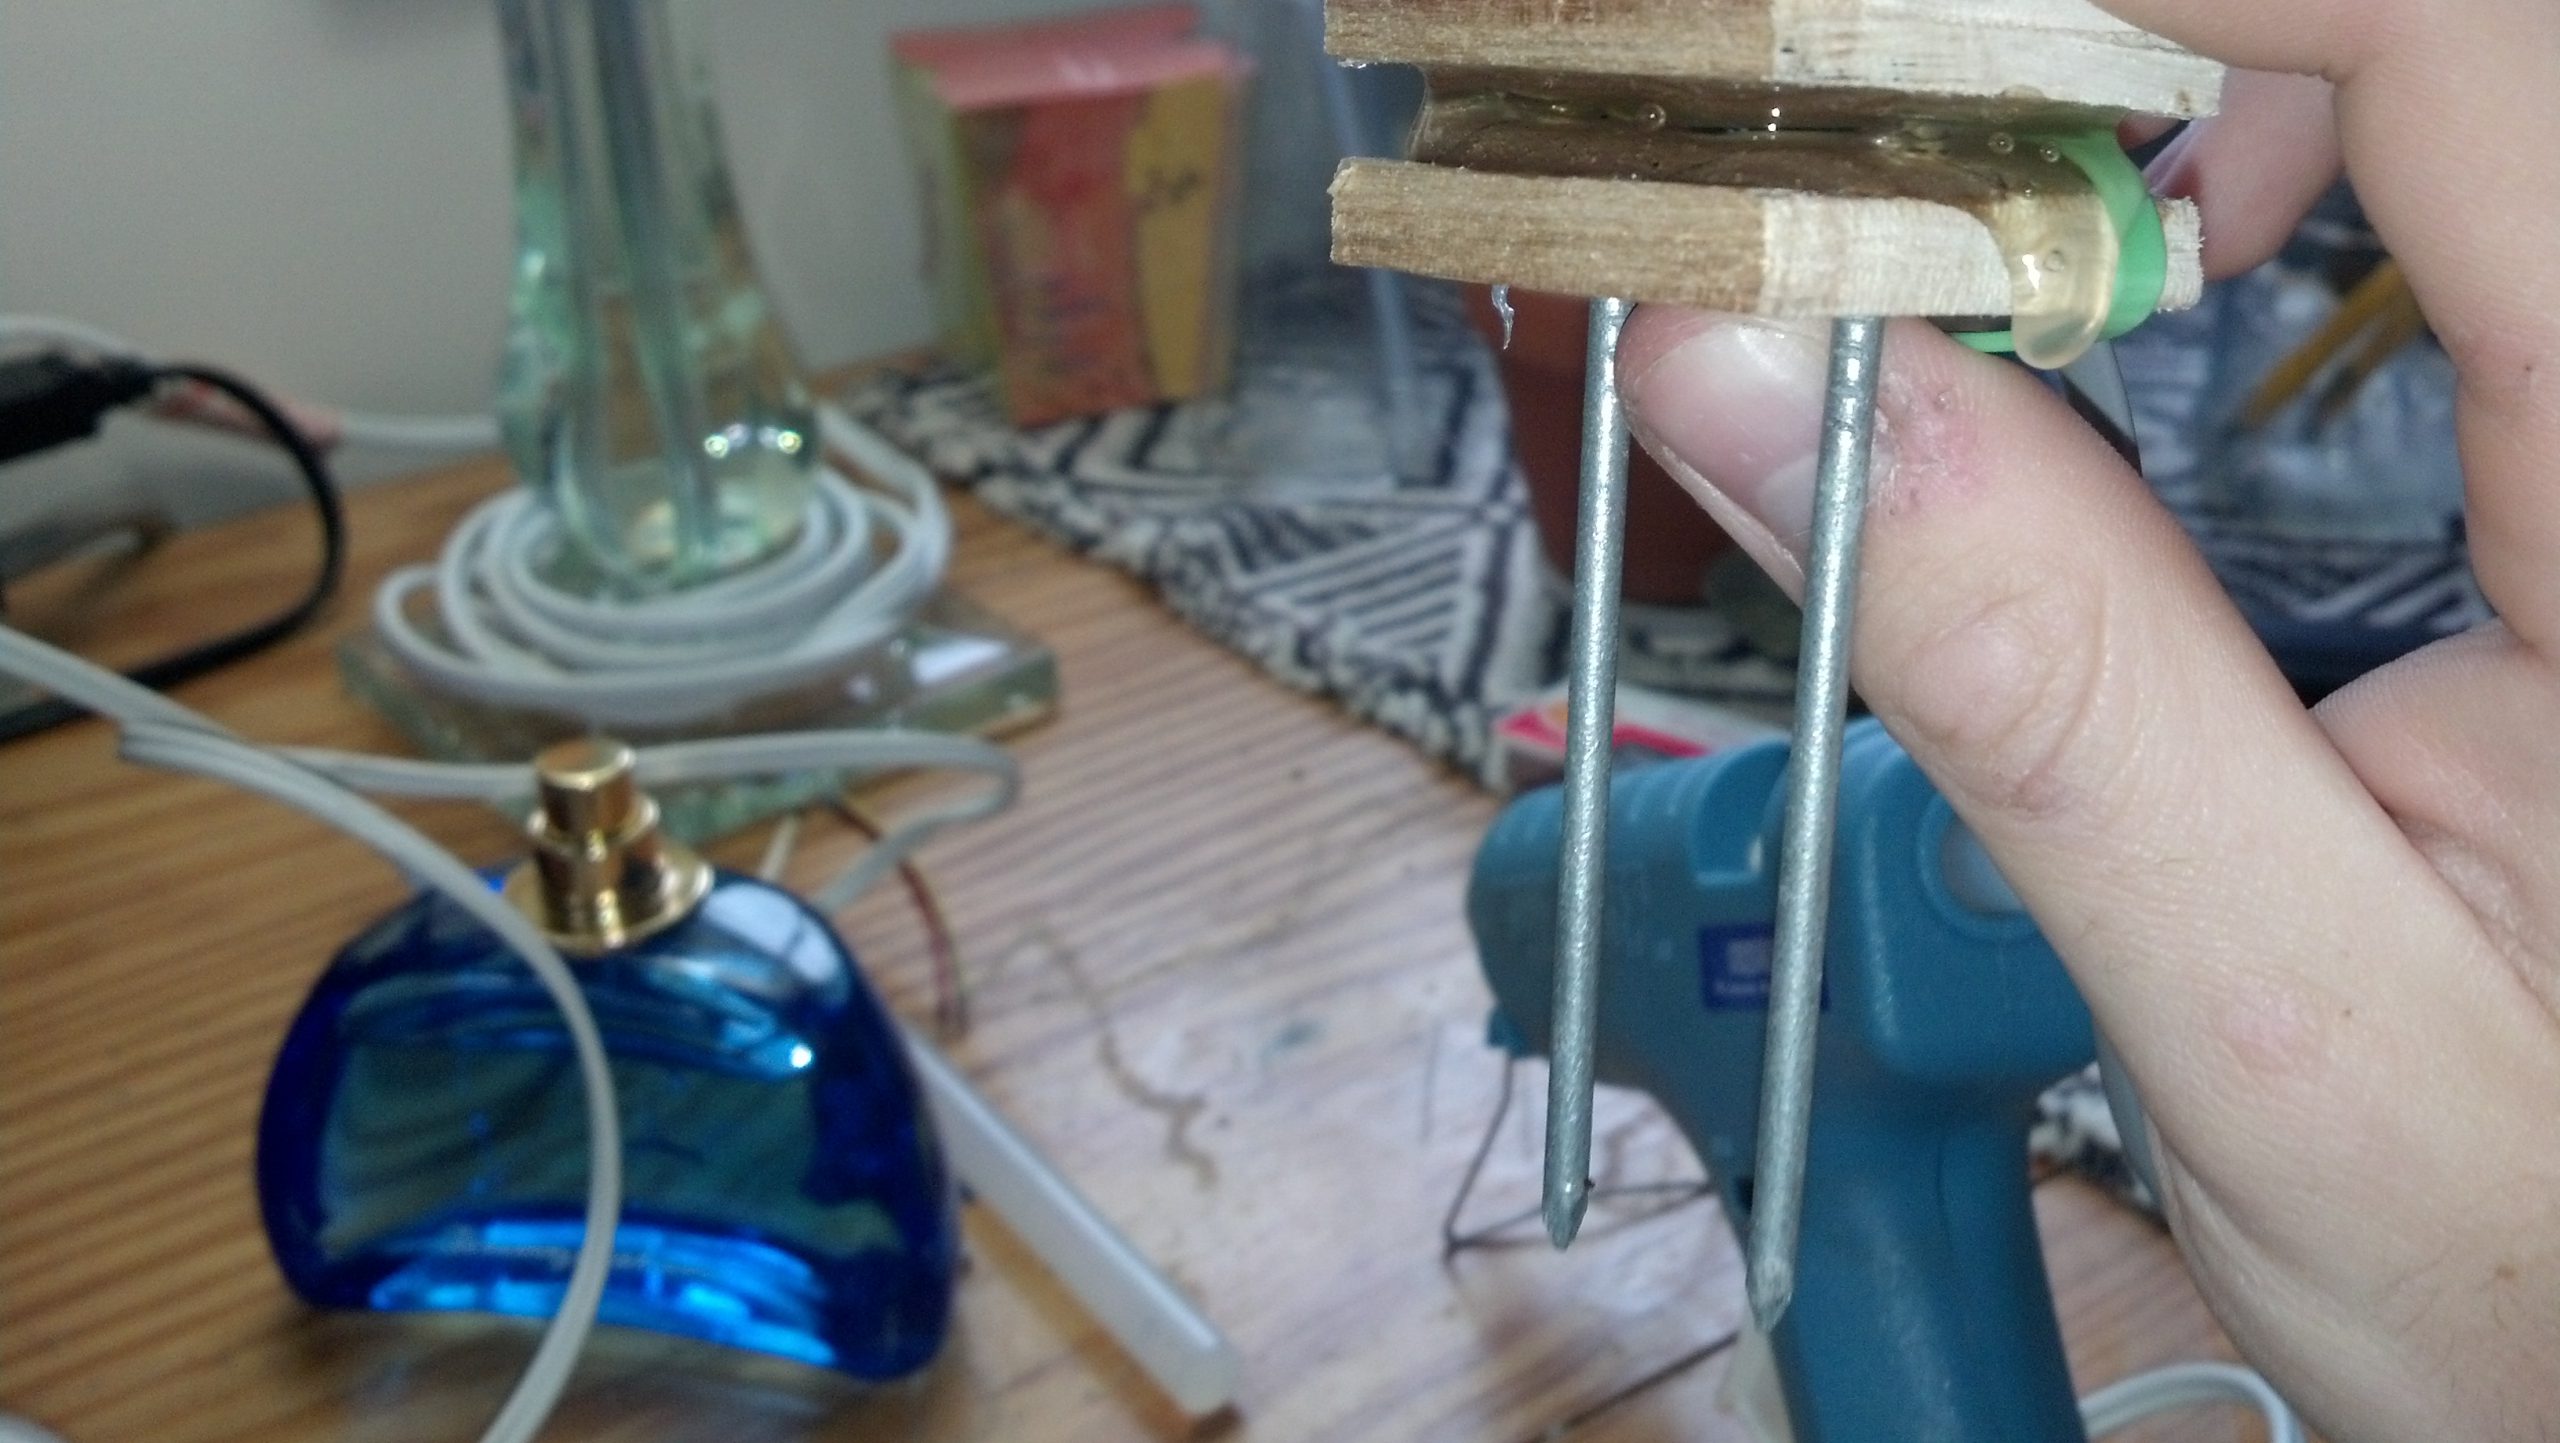
Here are the nails inserted into all 4
Here is the wire wrapped around the nail
Once solder is applied, the connection is very strong and conductive
Here’s the gluing process
Here are all of the sensors assembled. I attached headers to the other ends as seen in the last post.
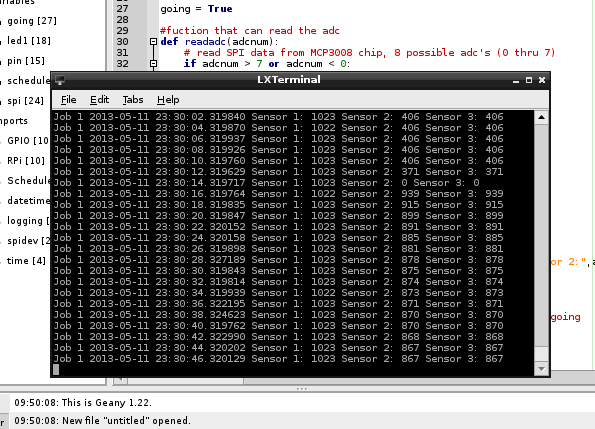
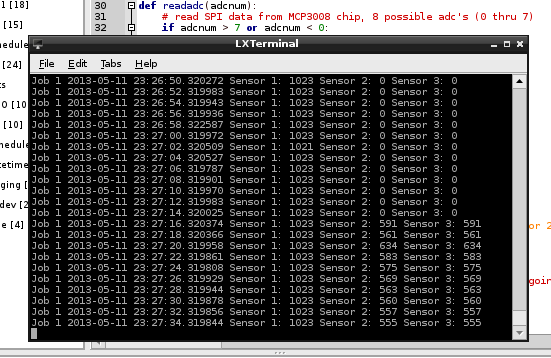
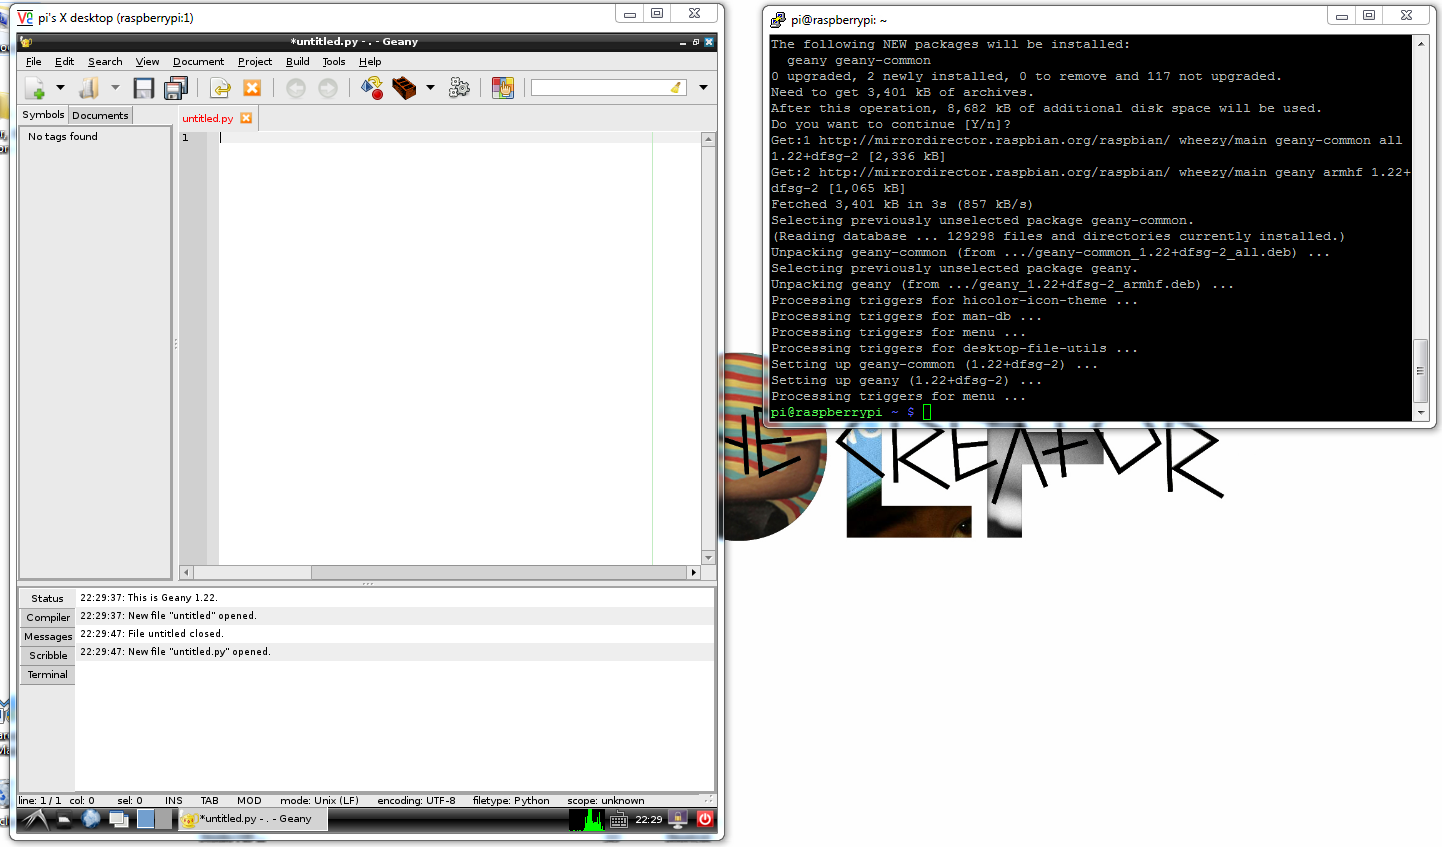
Since i’m using 4 sensors now, and to get around the oxidation problem, I added a NPN transistor to cut the ground current when the sensor isn’t being used so it only turns on when it’s getting polled. Here is the new python code:
|
1 2 3 4 5 6 7 8 9 10 11 12 13 14 15 16 17 18 19 20 21 22 23 24 25 26 27 28 29 30 31 32 33 34 35 36 37 38 39 40 41 42 43 44 45 46 47 48 49 50 51 52 53 54 55 56 57 58 59 60 61 62 63 64 65 66 67 68 69 70 71 72 73 74 75 76 77 78 79 80 81 |
#Timing setup from datetime import datetime from apscheduler.scheduler import Scheduler import time import datetime import sys now =datetime.datetime.now() import logging #if you start getting logging errors, uncomment these two lines logging.basicConfig() #GPIO setup import RPi.GPIO as GPIO GPIO.setmode(GPIO.BOARD) GPIO.cleanup() pin = 26 #pin for the adc GPIO.setup(pin, GPIO.OUT) NPNtrans = 3 #the pin for the npn transistor GPIO.setup(NPNtrans, GPIO.OUT) sampleLED = 5 #the indicator LED GPIO.setup(sampleLED, GPIO.OUT) #the adc's SPI setup import spidev spi = spidev.SpiDev() spi.open(0, 0) import MySQLdb con = MySQLdb.connect('localhost','piplanter_user','piplanter_pass','piplanter'); cursor = con.cursor() #fuction that can read the adc def readadc(adcnum): # read SPI data from MCP3008 chip, 8 possible adc's (0 thru 7) if adcnum > 7 or adcnum < 0: return -1 r = spi.xfer2([1, 8 + adcnum << 4, 0]) adcout = ((r[1] & 3) << 8) + r[2] return adcout def slowSample(): GPIO.output(NPNtrans, True) GPIO.output(sampleLED, True) sampleTime =time.ctime() mst1 = readadc(0) mst2 = readadc(1) mst3 = readadc(2) mst4 = readadc(3) pot1 = readadc(4) ldr1 = readadc(5) millivolts = readadc(6)*(3300.0/1024.0) temp_c = ((millivolts - 100.0)/10)-40.0 tmp1 = (temp_c * 9.0 / 5.0) + 32 print sampleTime,"|","MST1:",mst1,"MST2:",mst2,"MST3:",mst3,"MST4:",mst4,"Pot1:",pot1,"LDR1:",ldr1,"TMP1:",tmp1 #prints the debug info cursor.execute("INSERT INTO piplanter_table_13(Time,mst1_V,mst2_V,mst3_V,mst4_V,pot1_V,ldr1_V,tmp1_F) VALUES(%s,%s,%s,%s,%s,%s,%s,%s)",(sampleTime,mst1,mst2,mst3,mst4,pot1,ldr1,tmp1)) con.commit() #this is important for live updating time.sleep(.1) GPIO.output(sampleLED, False) GPIO.output(NPNtrans, False) slowSample() if __name__ == '__main__': #the following 3 lines start up the interval job and keep it going scheduler = Scheduler(standalone=True) scheduler.add_interval_job(slowSample, hours=1) scheduler.start() |
It’s pretty much the same thing.
The graph is also very similar, but I won’t post that code as it’s not different enough.
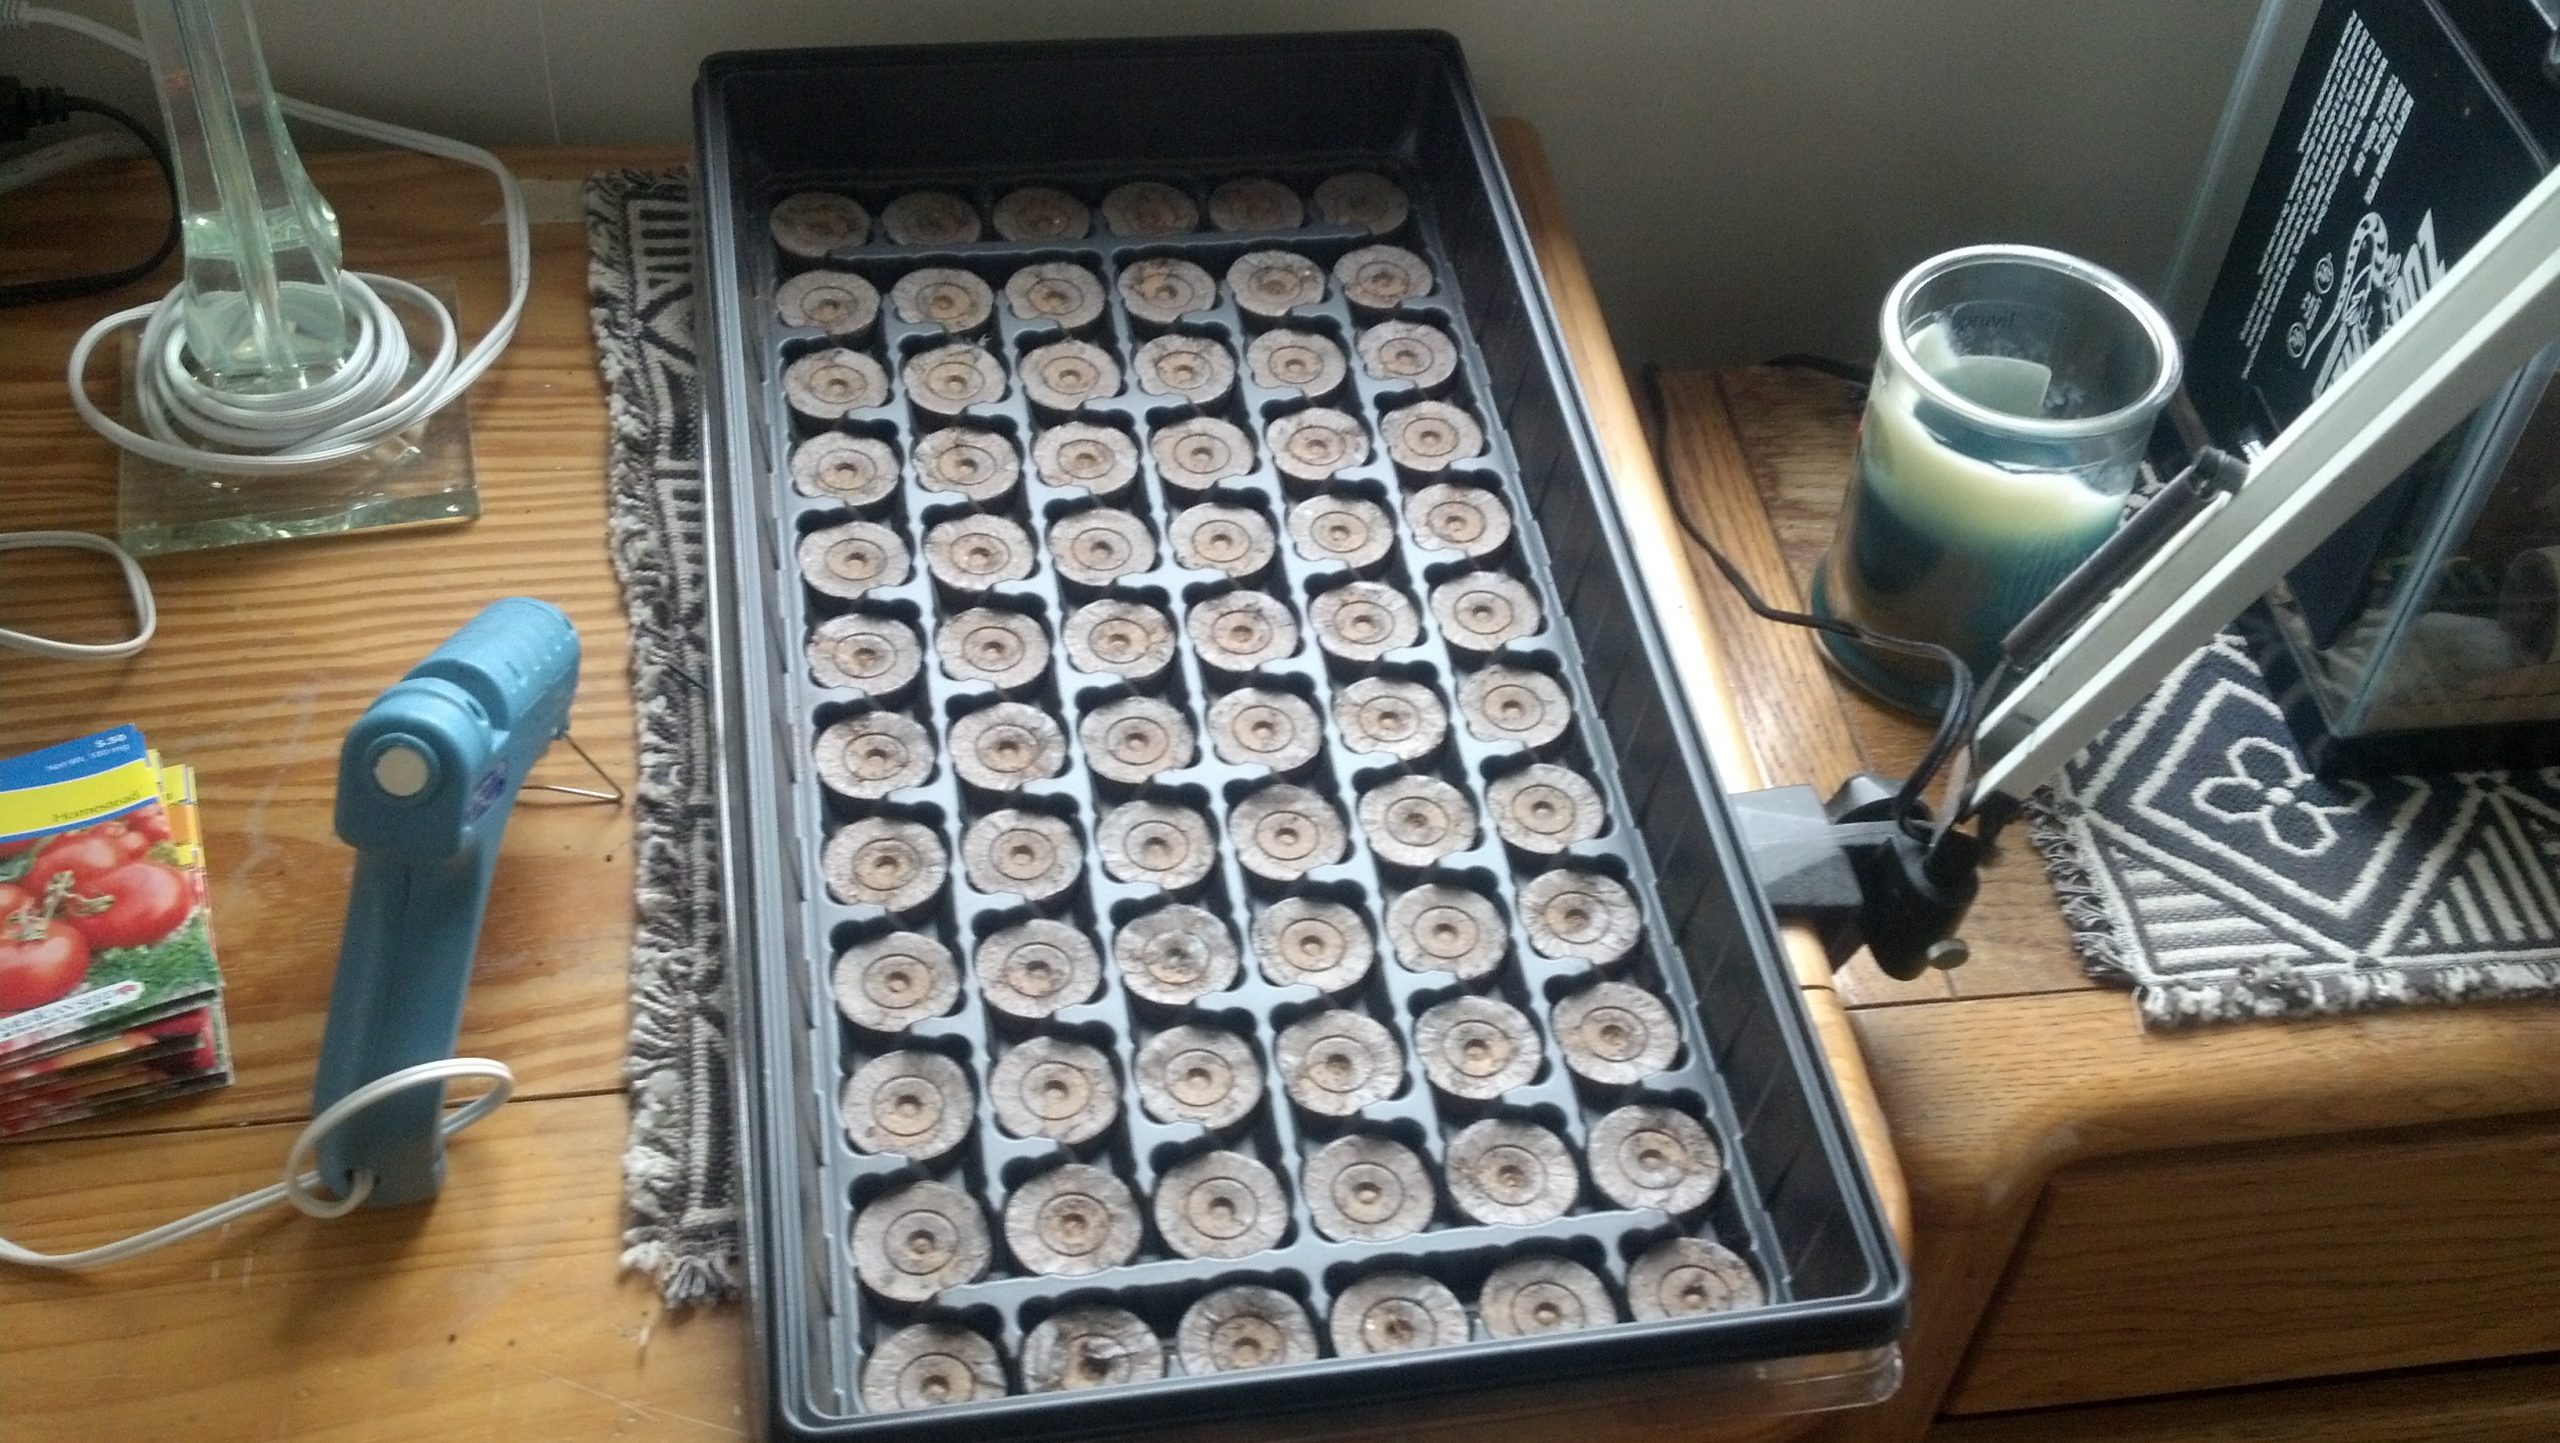
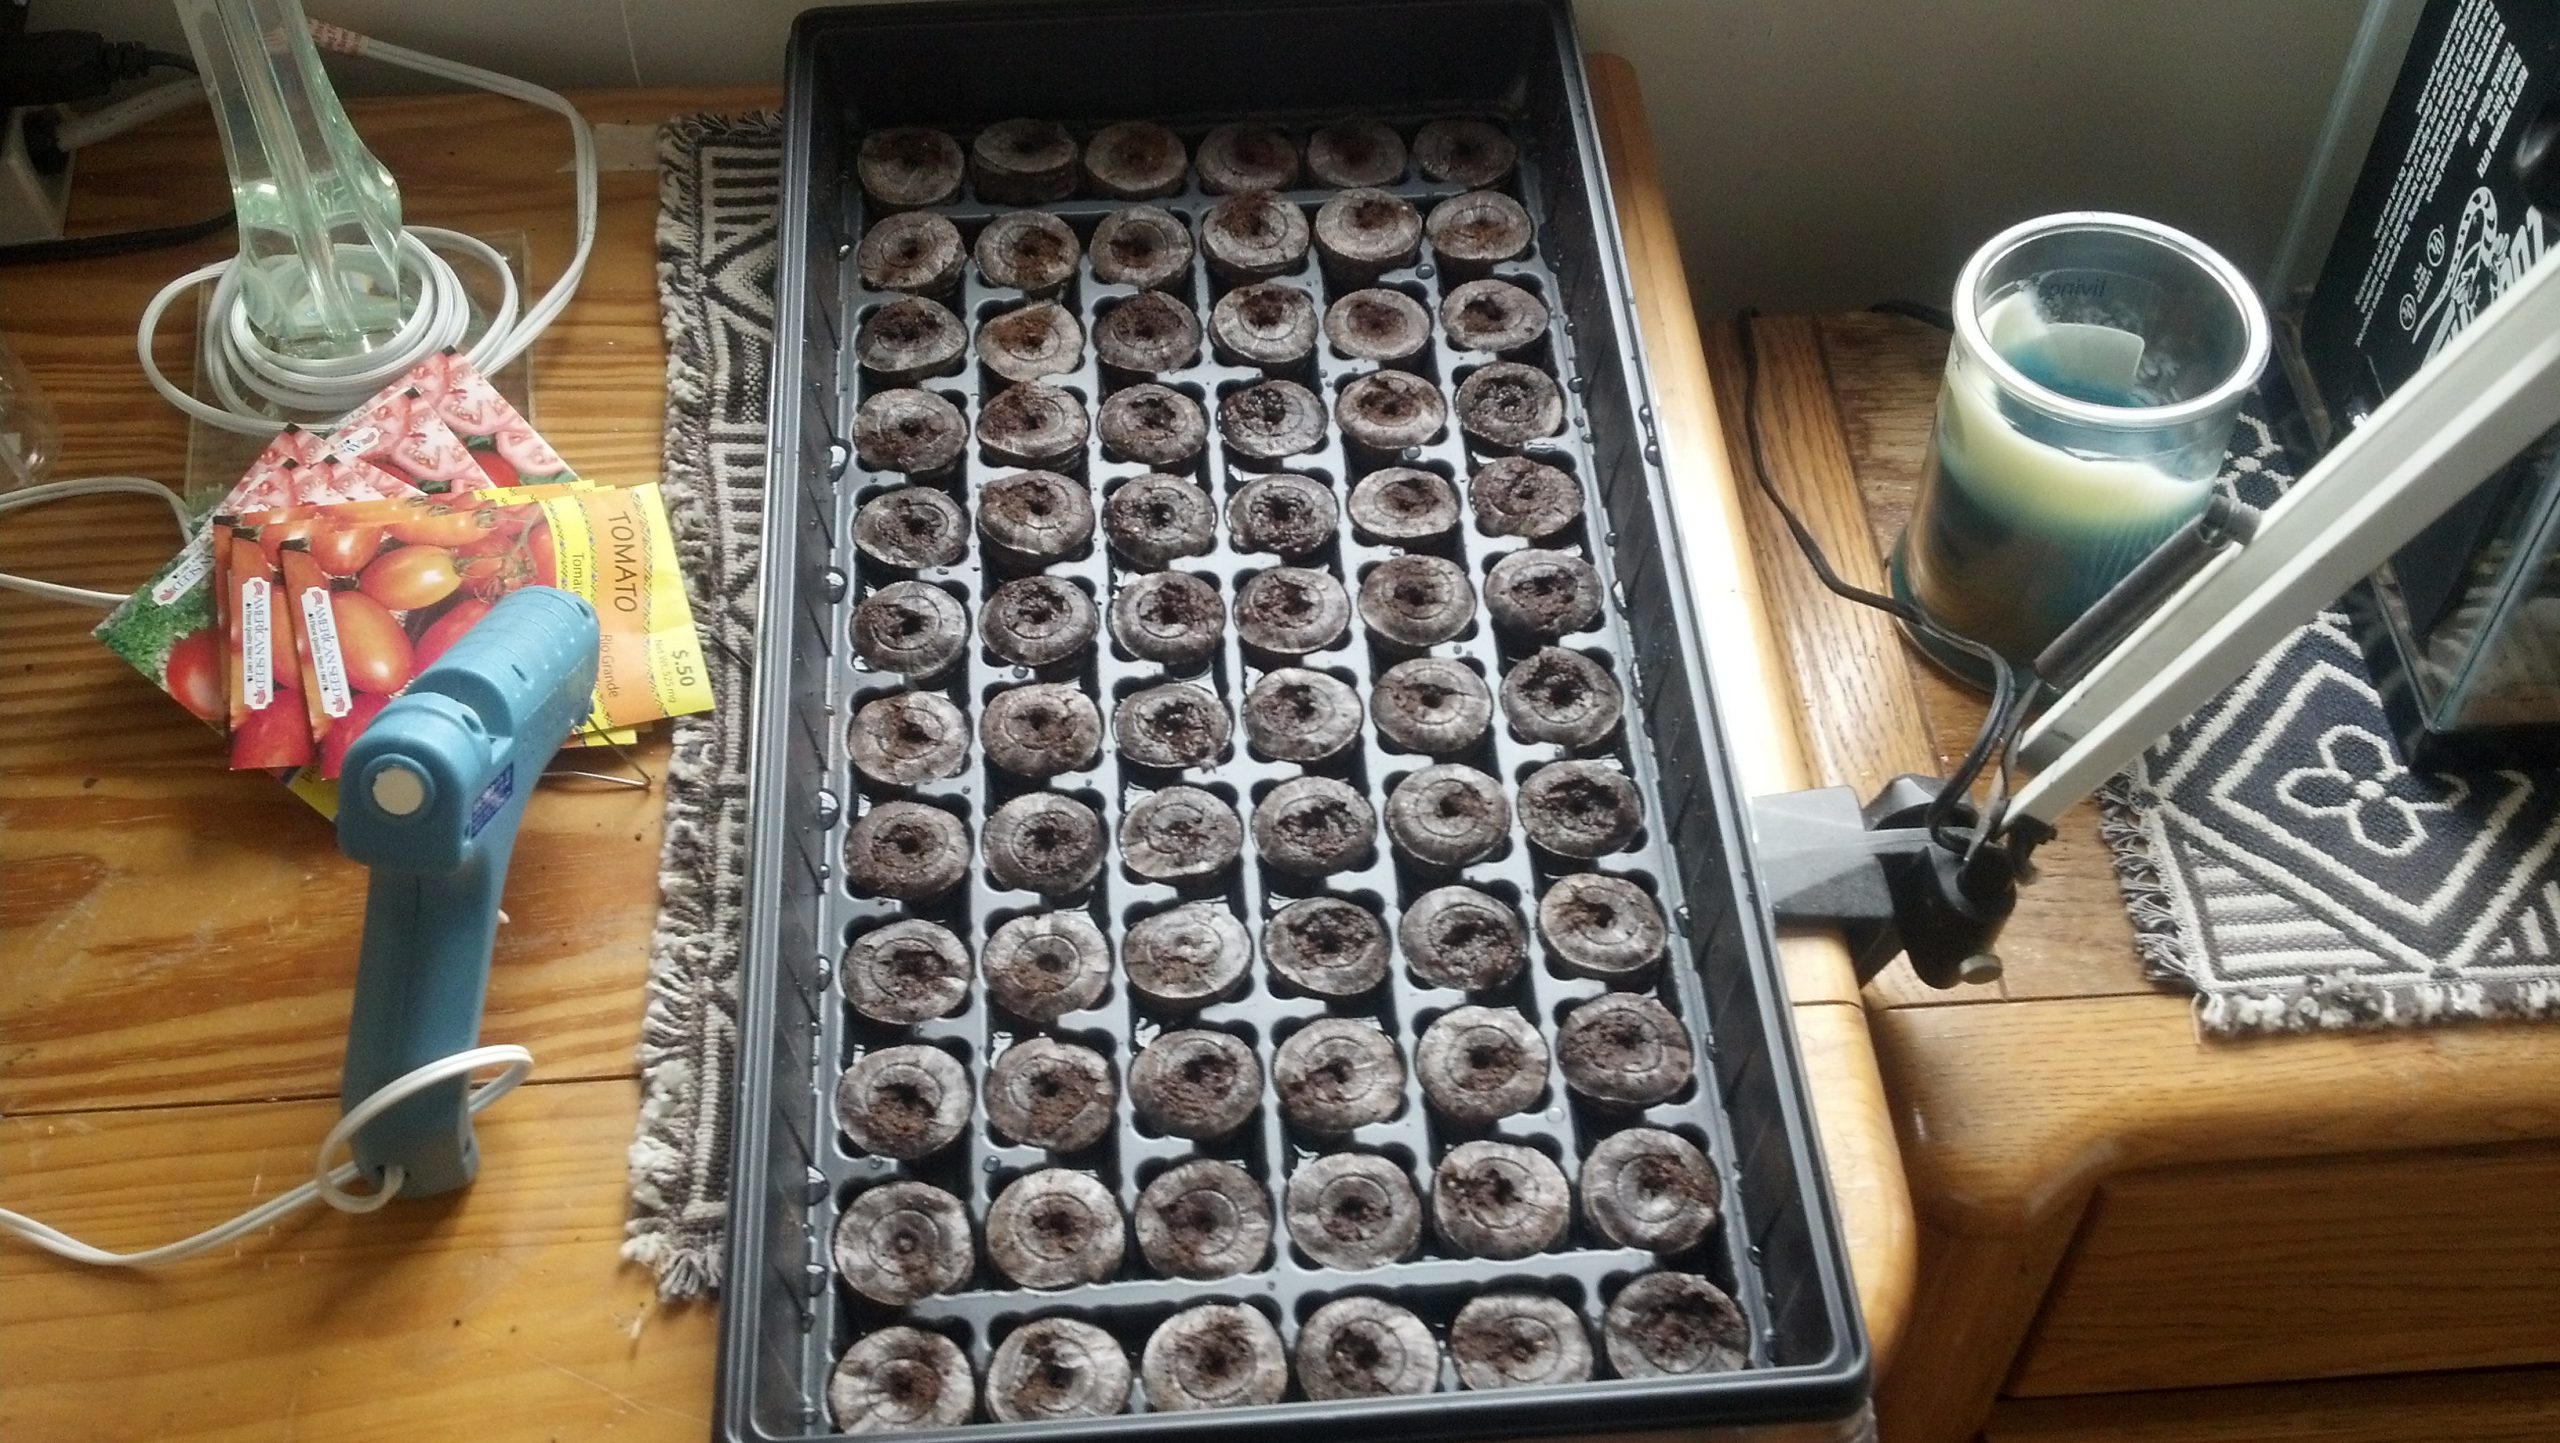
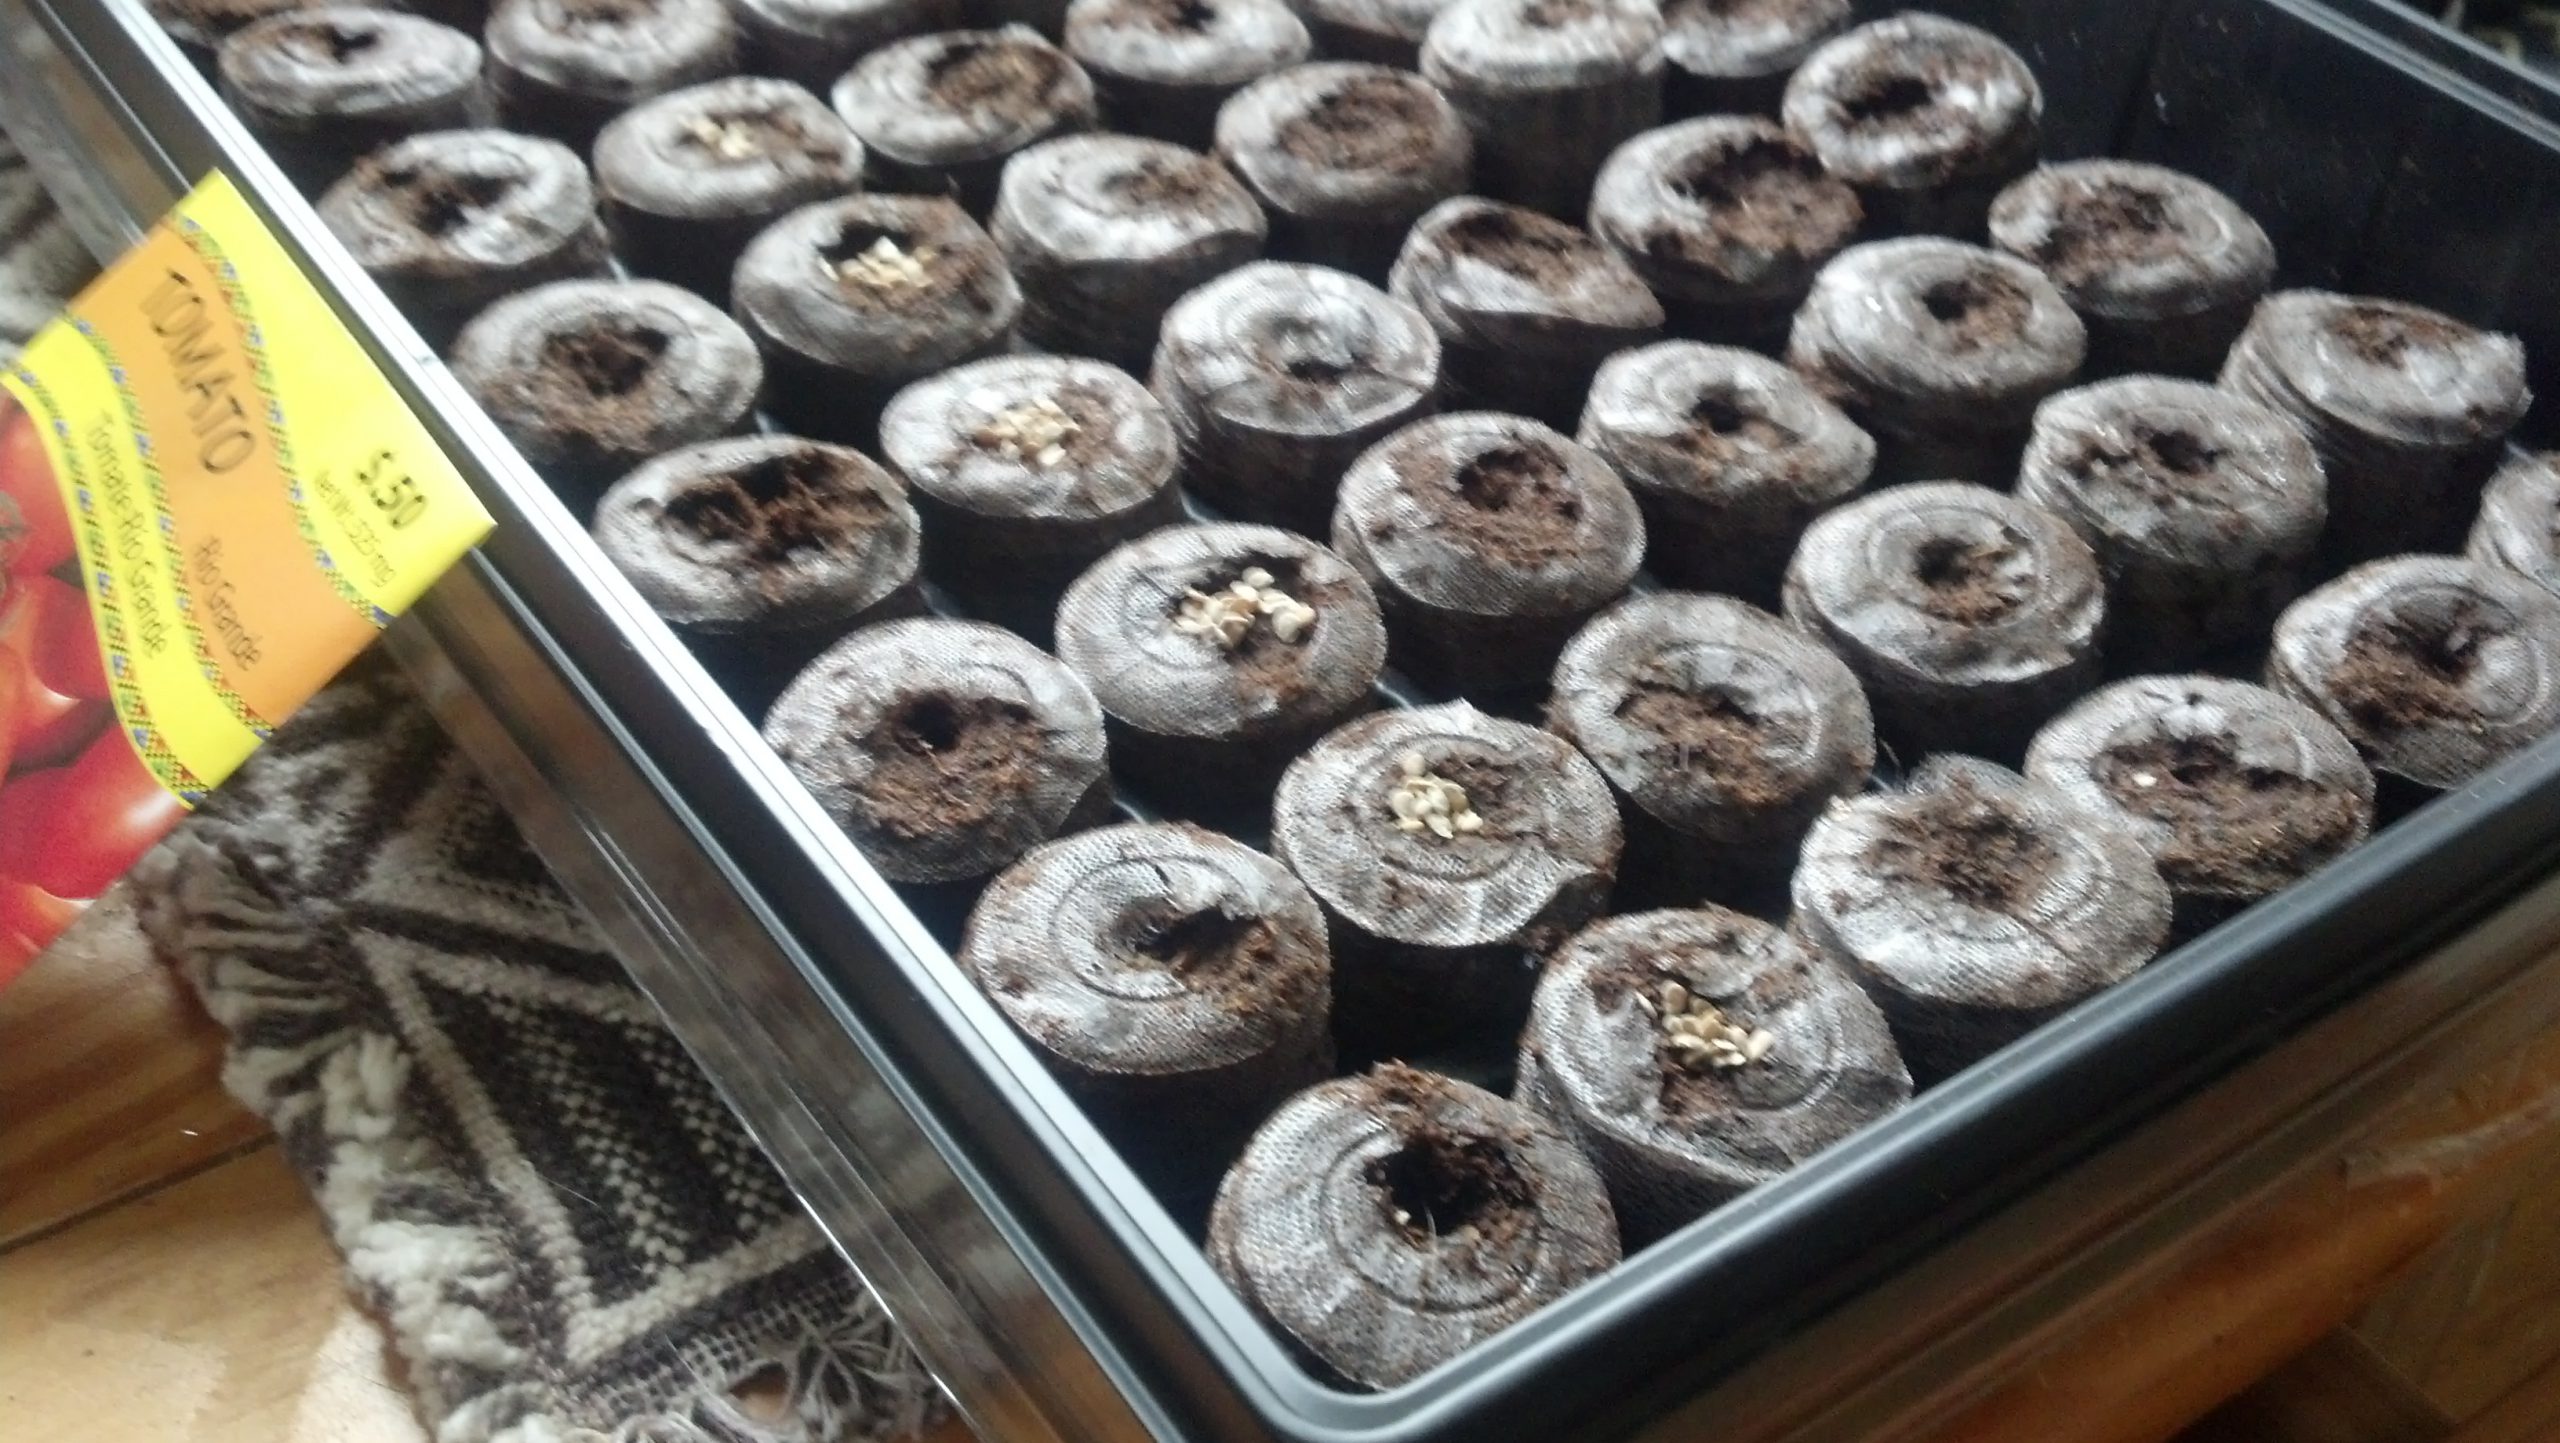
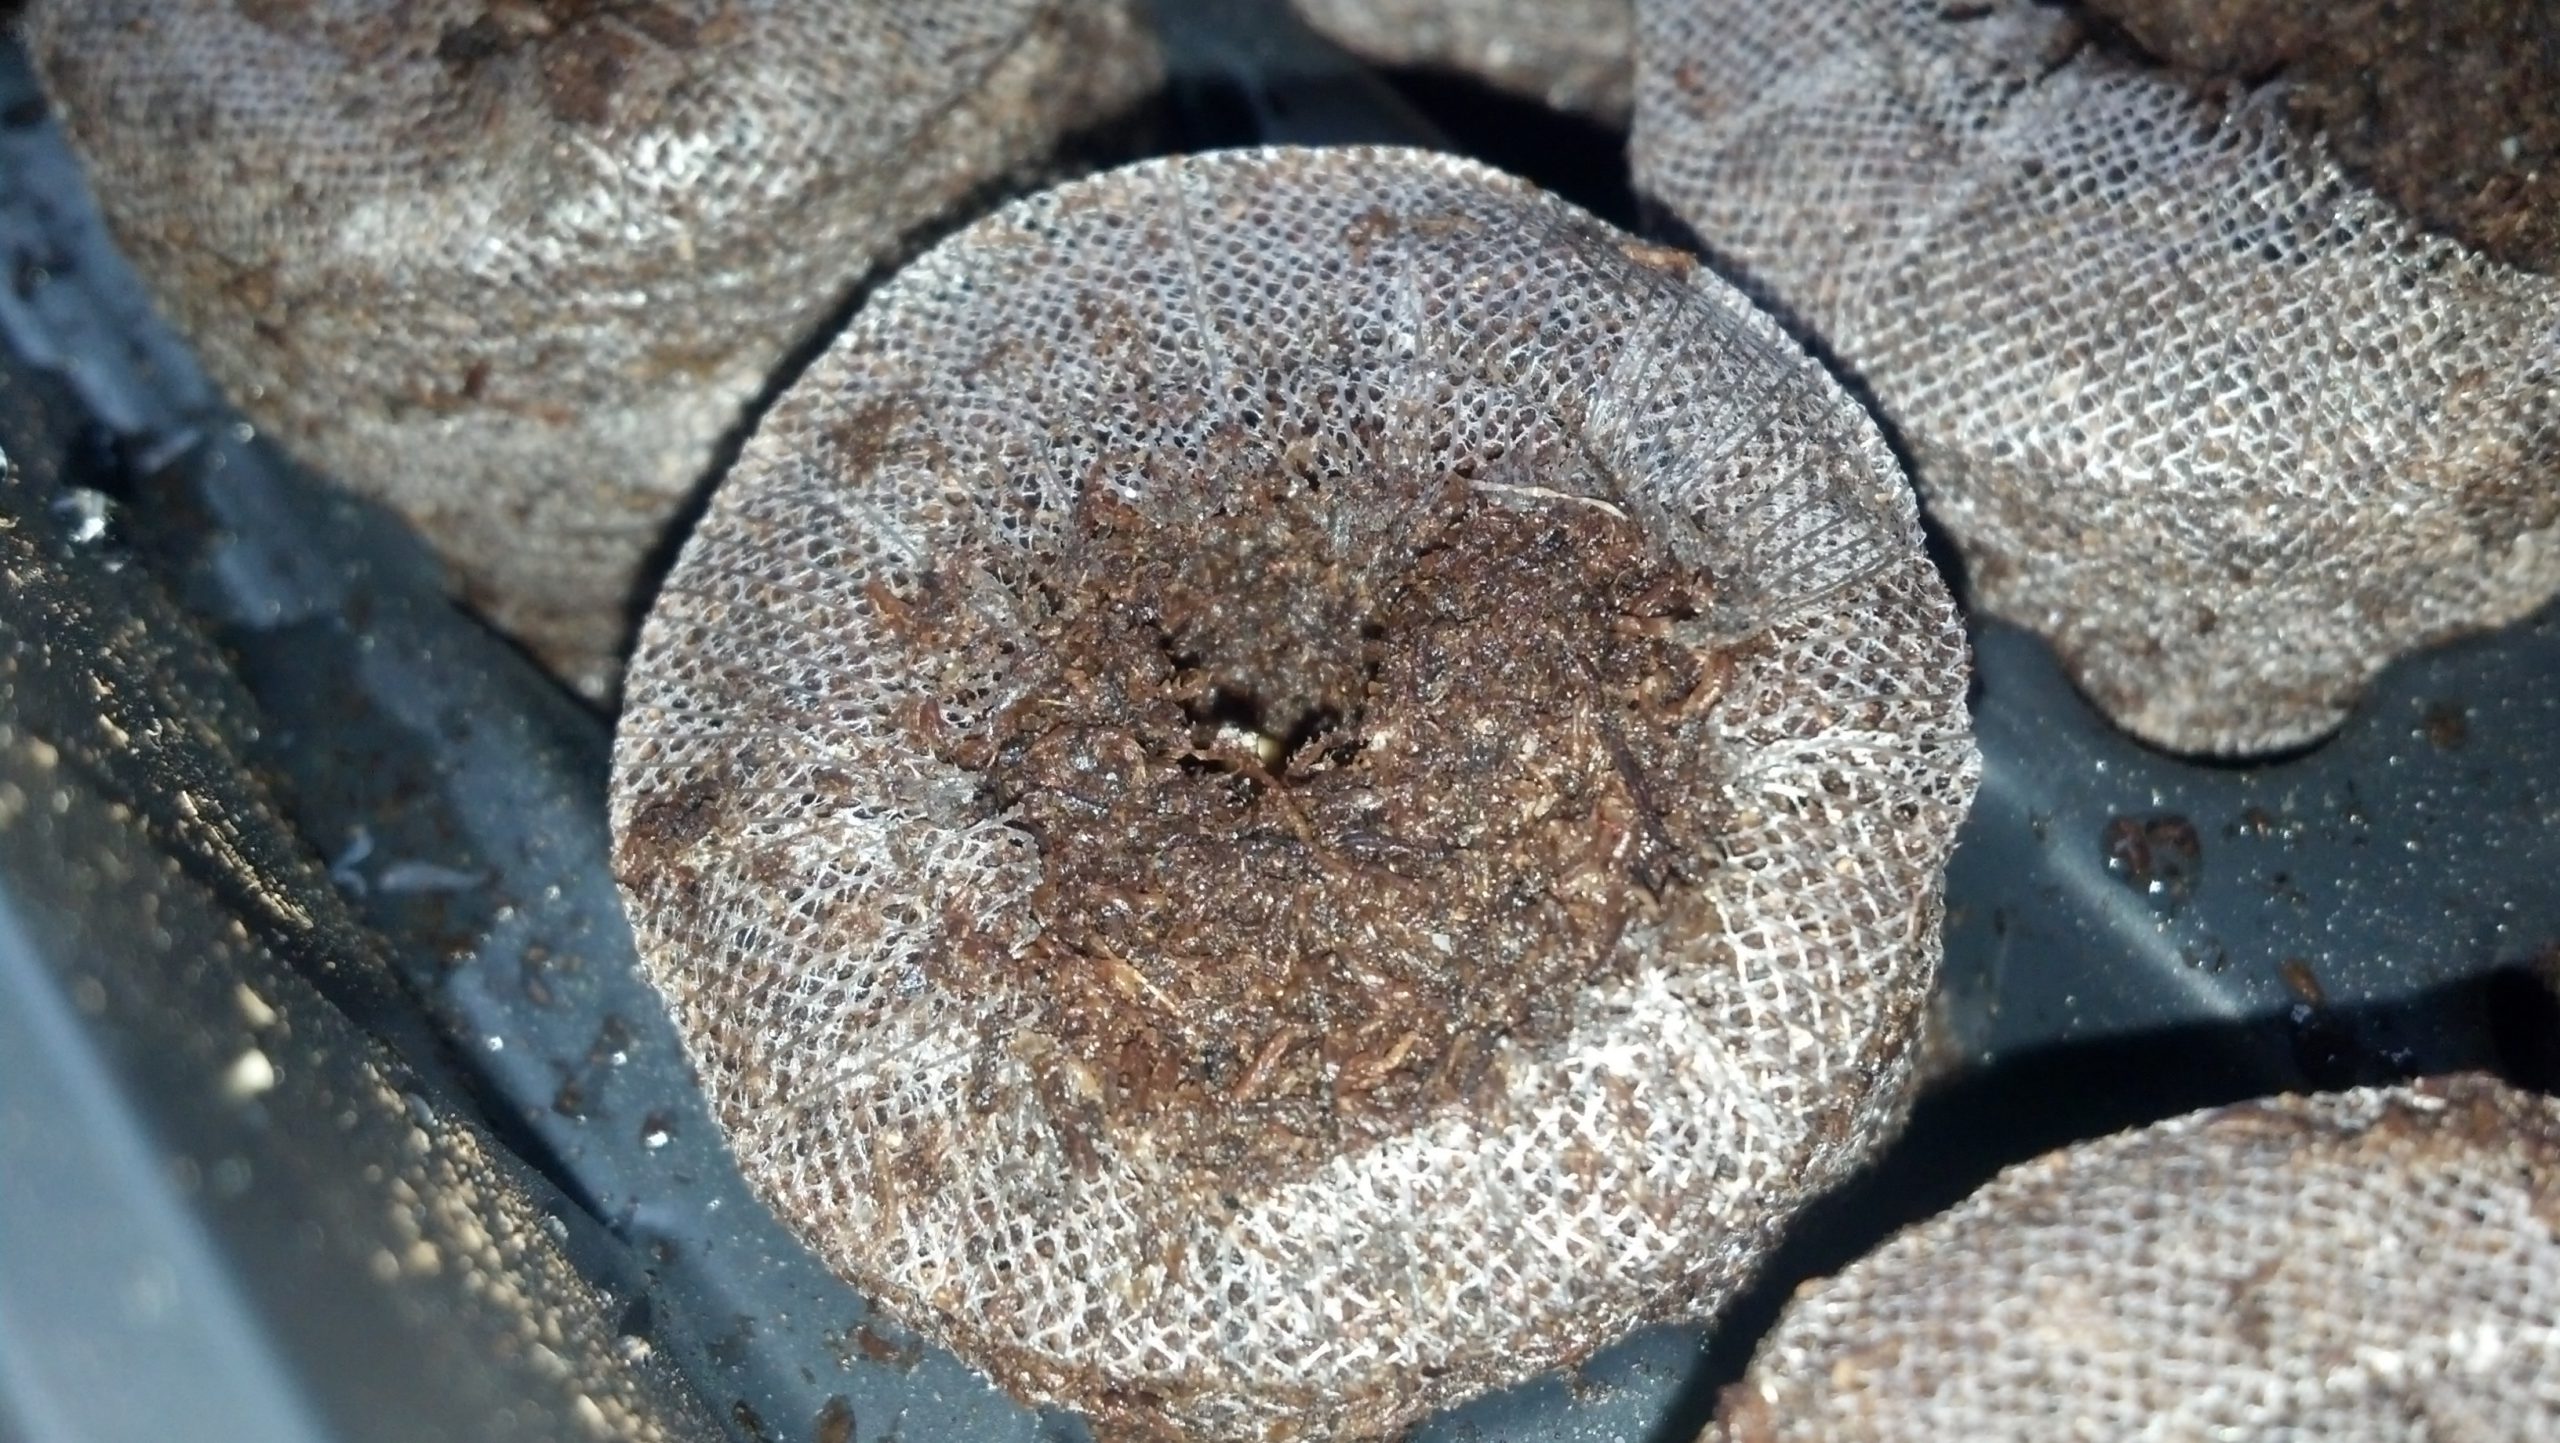
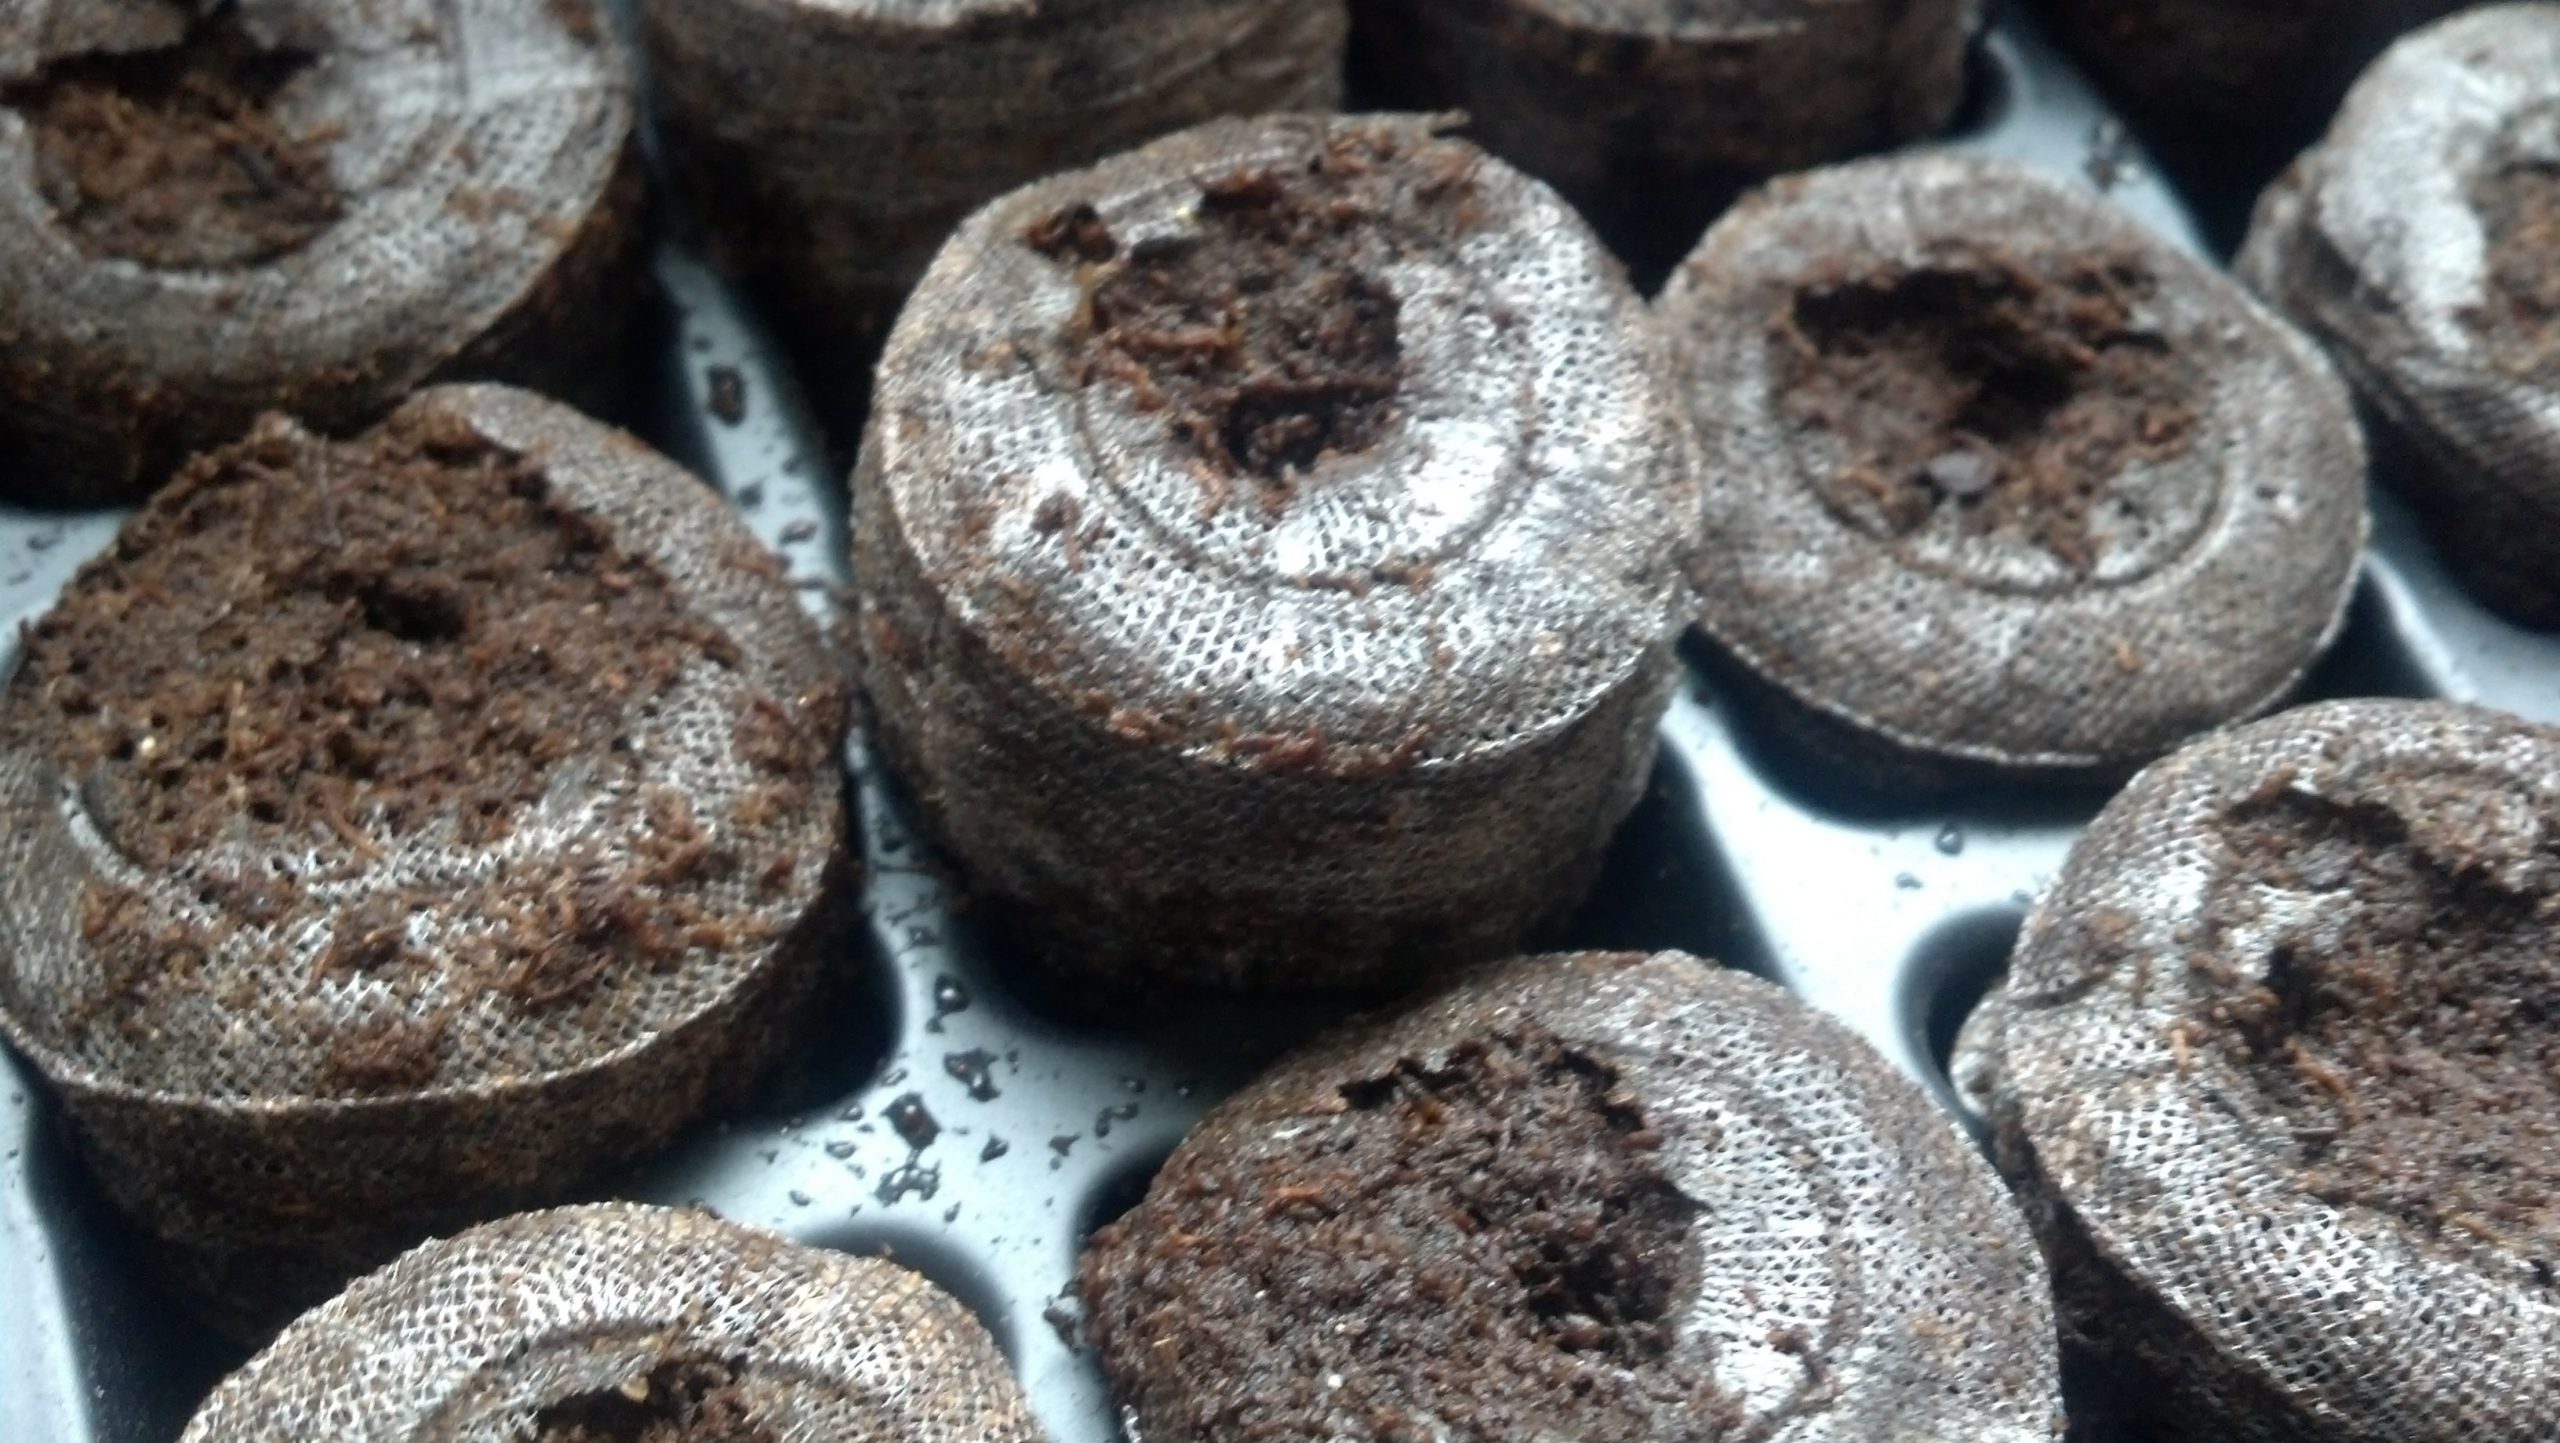
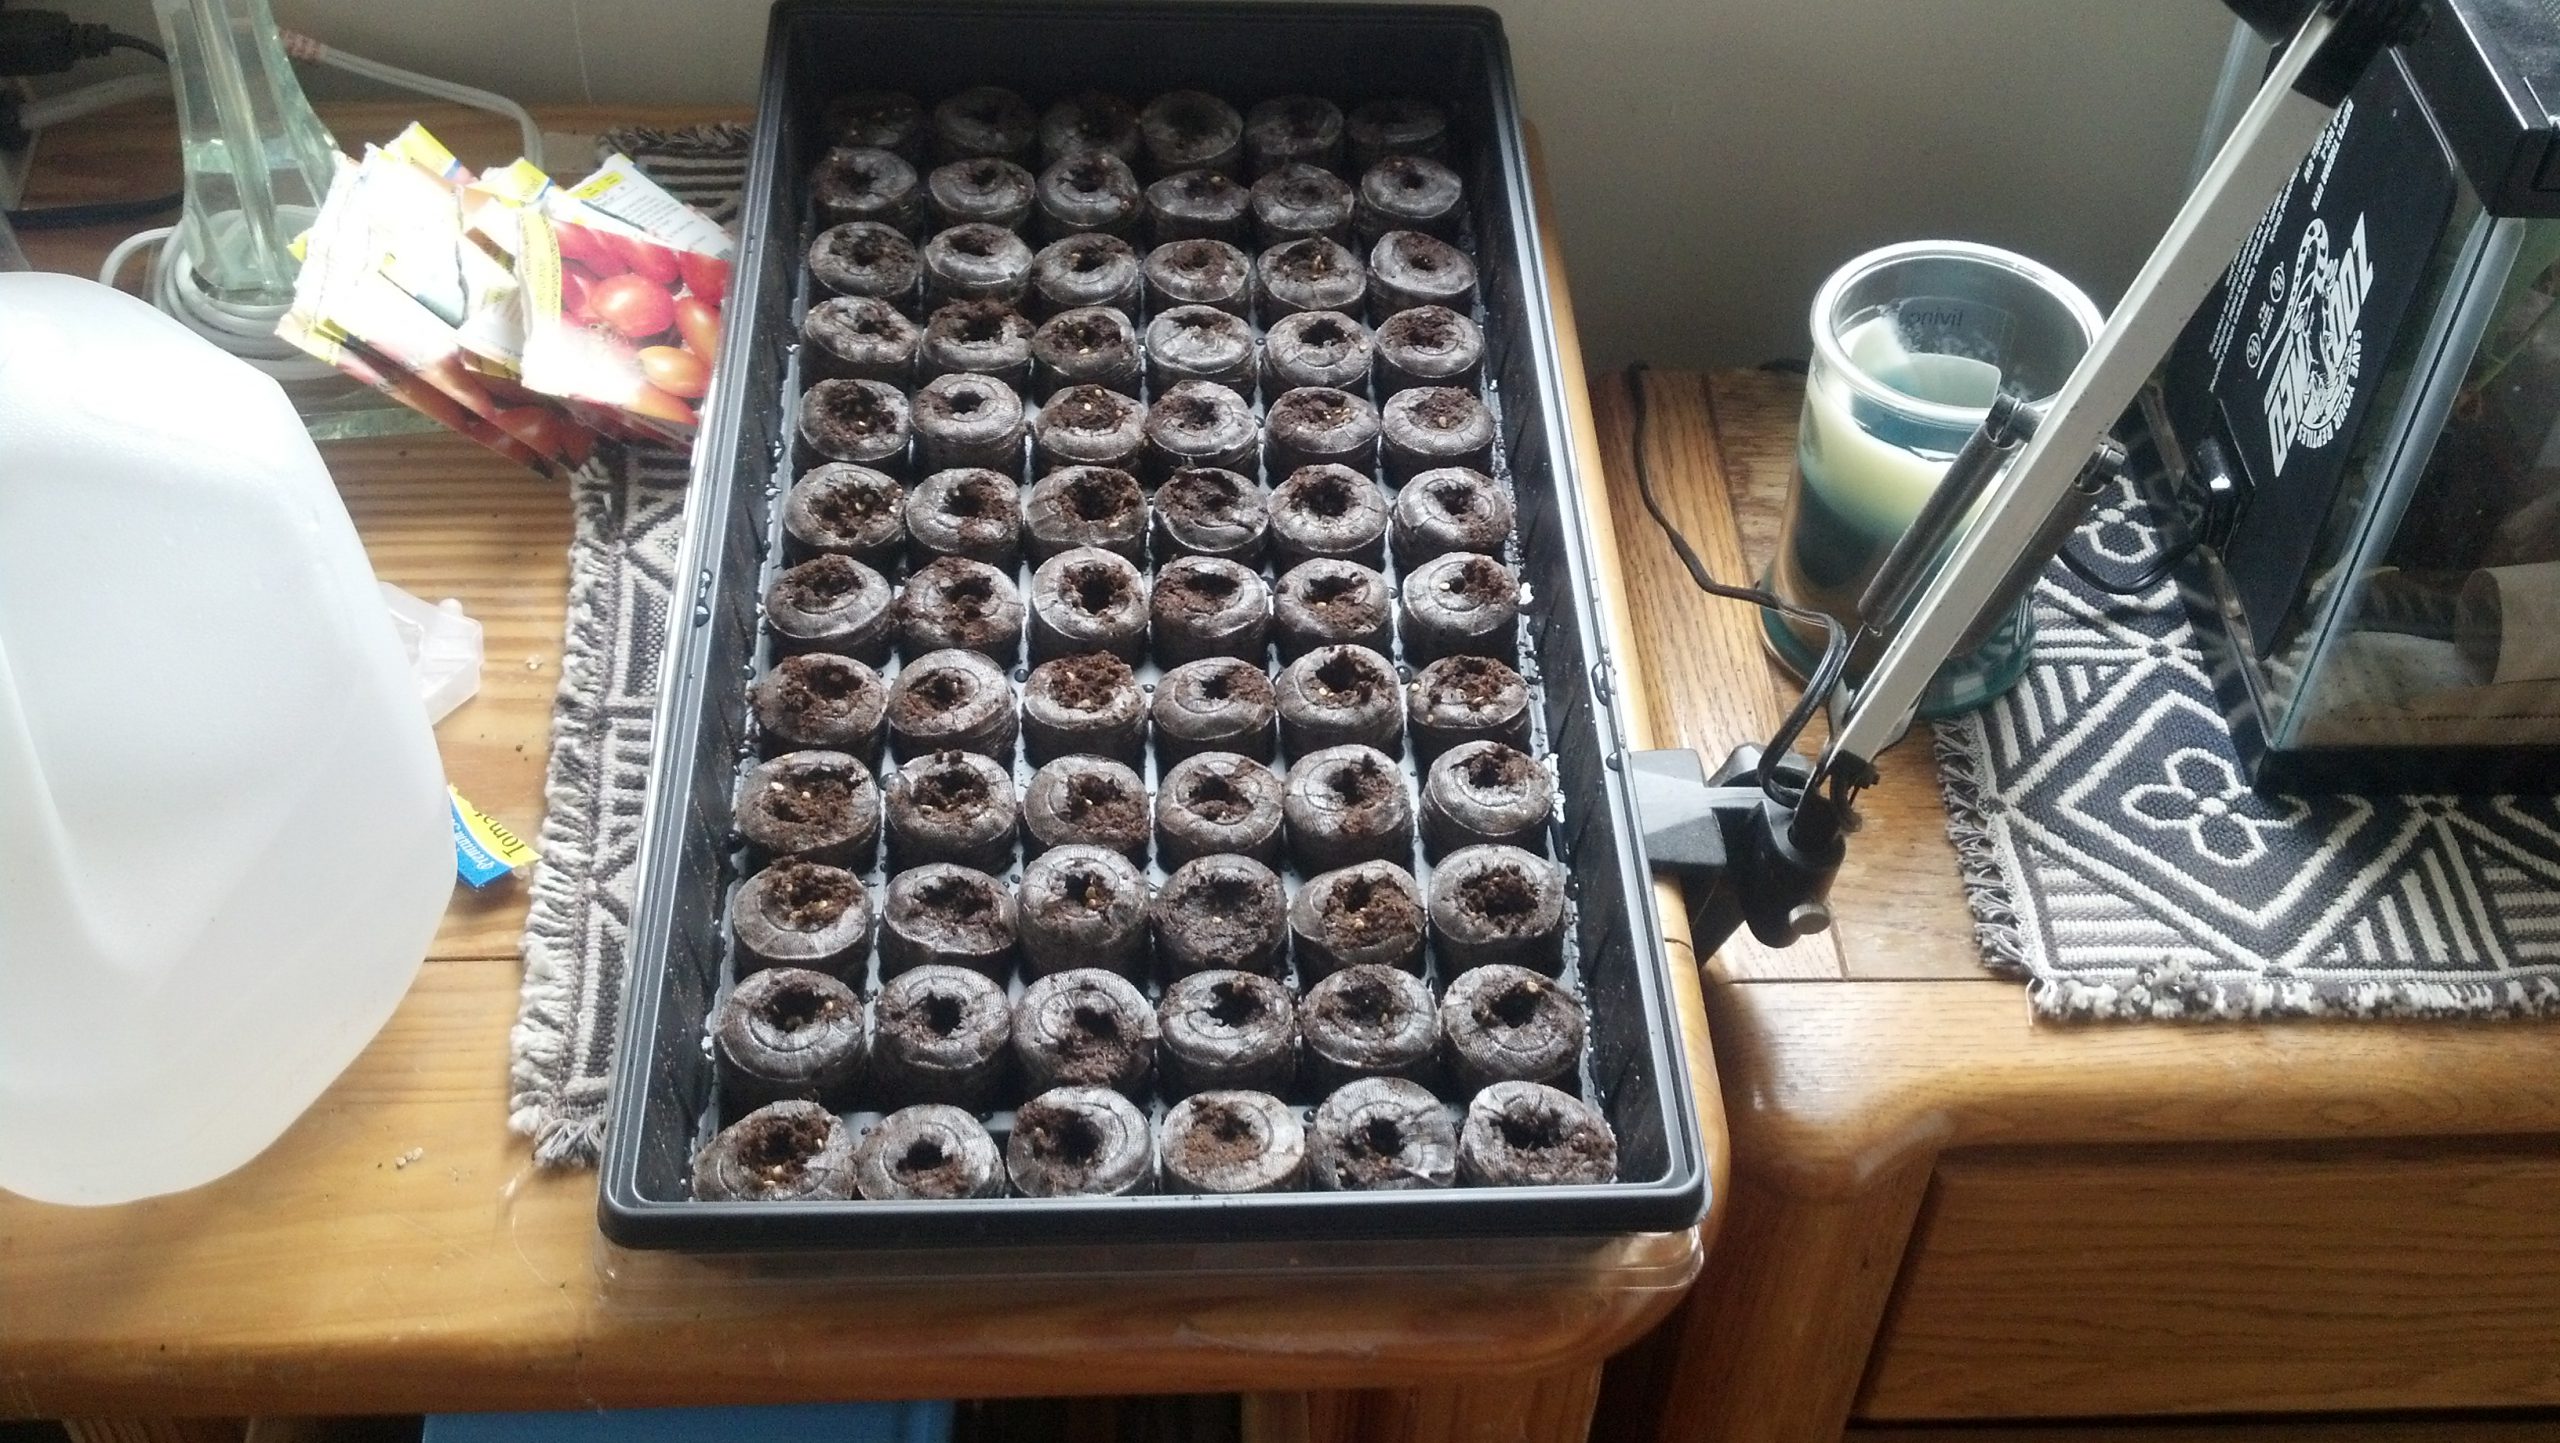
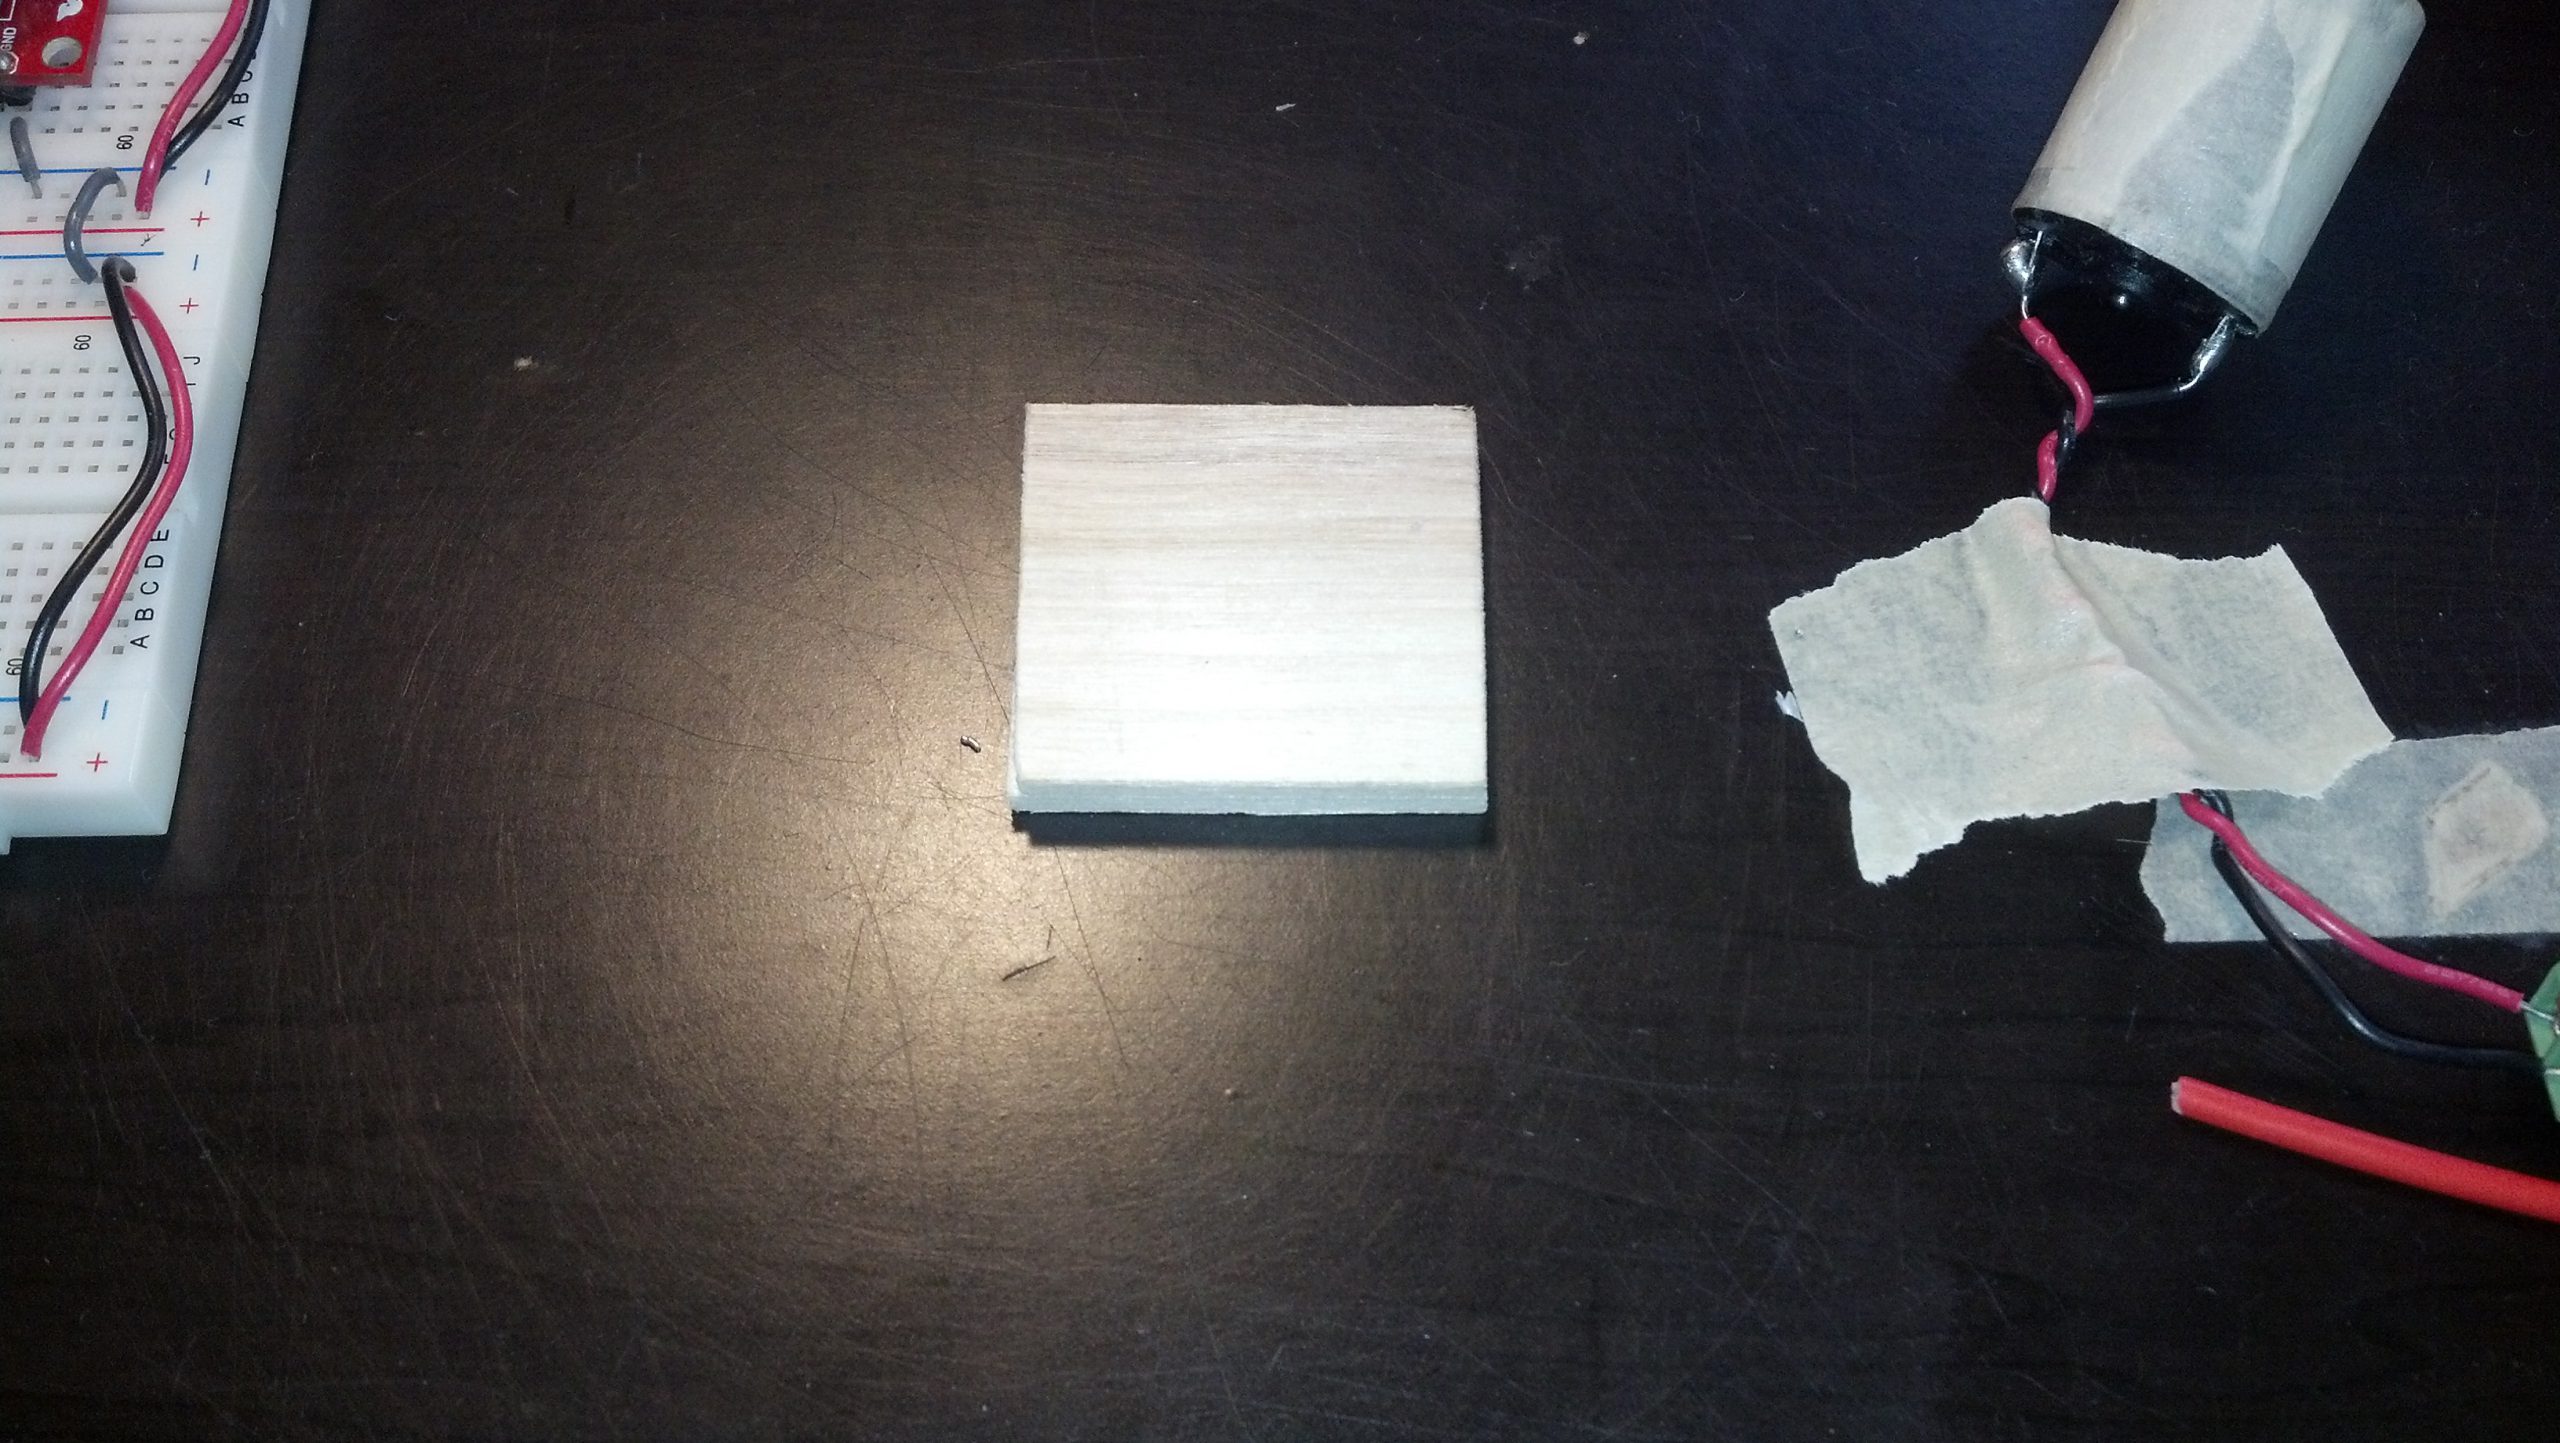
Here are pictures of setting up the whole system:
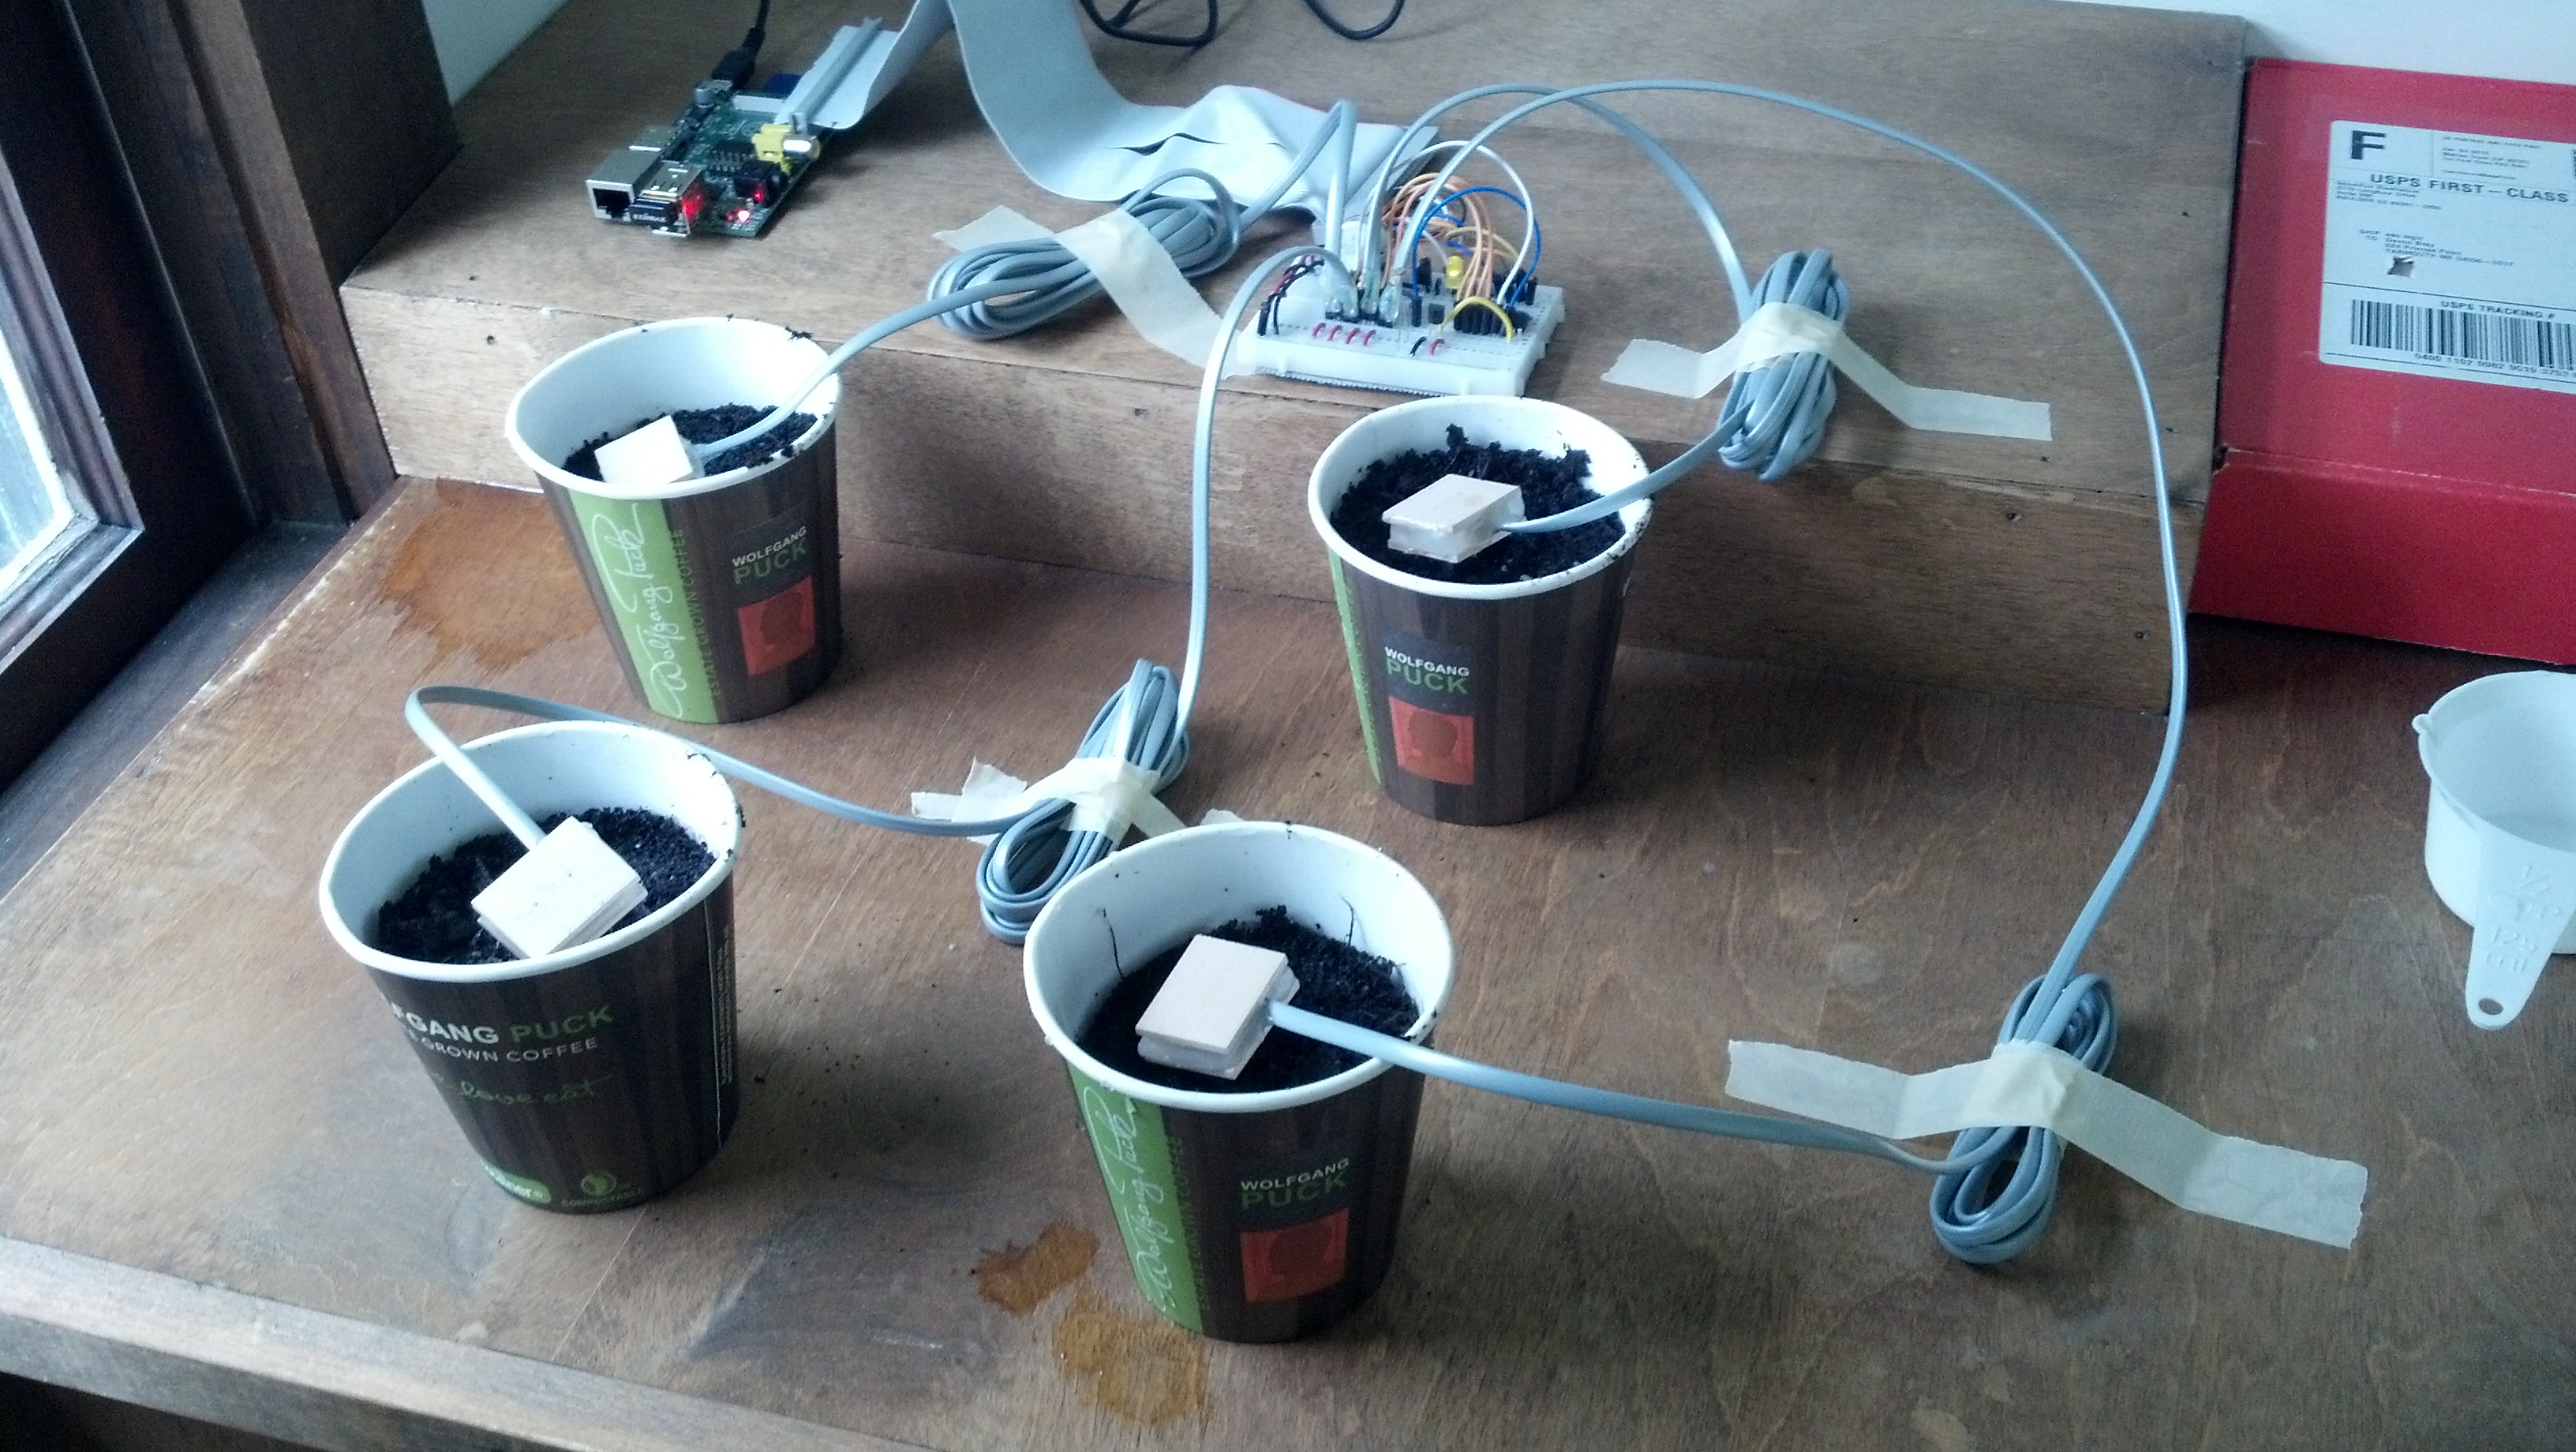
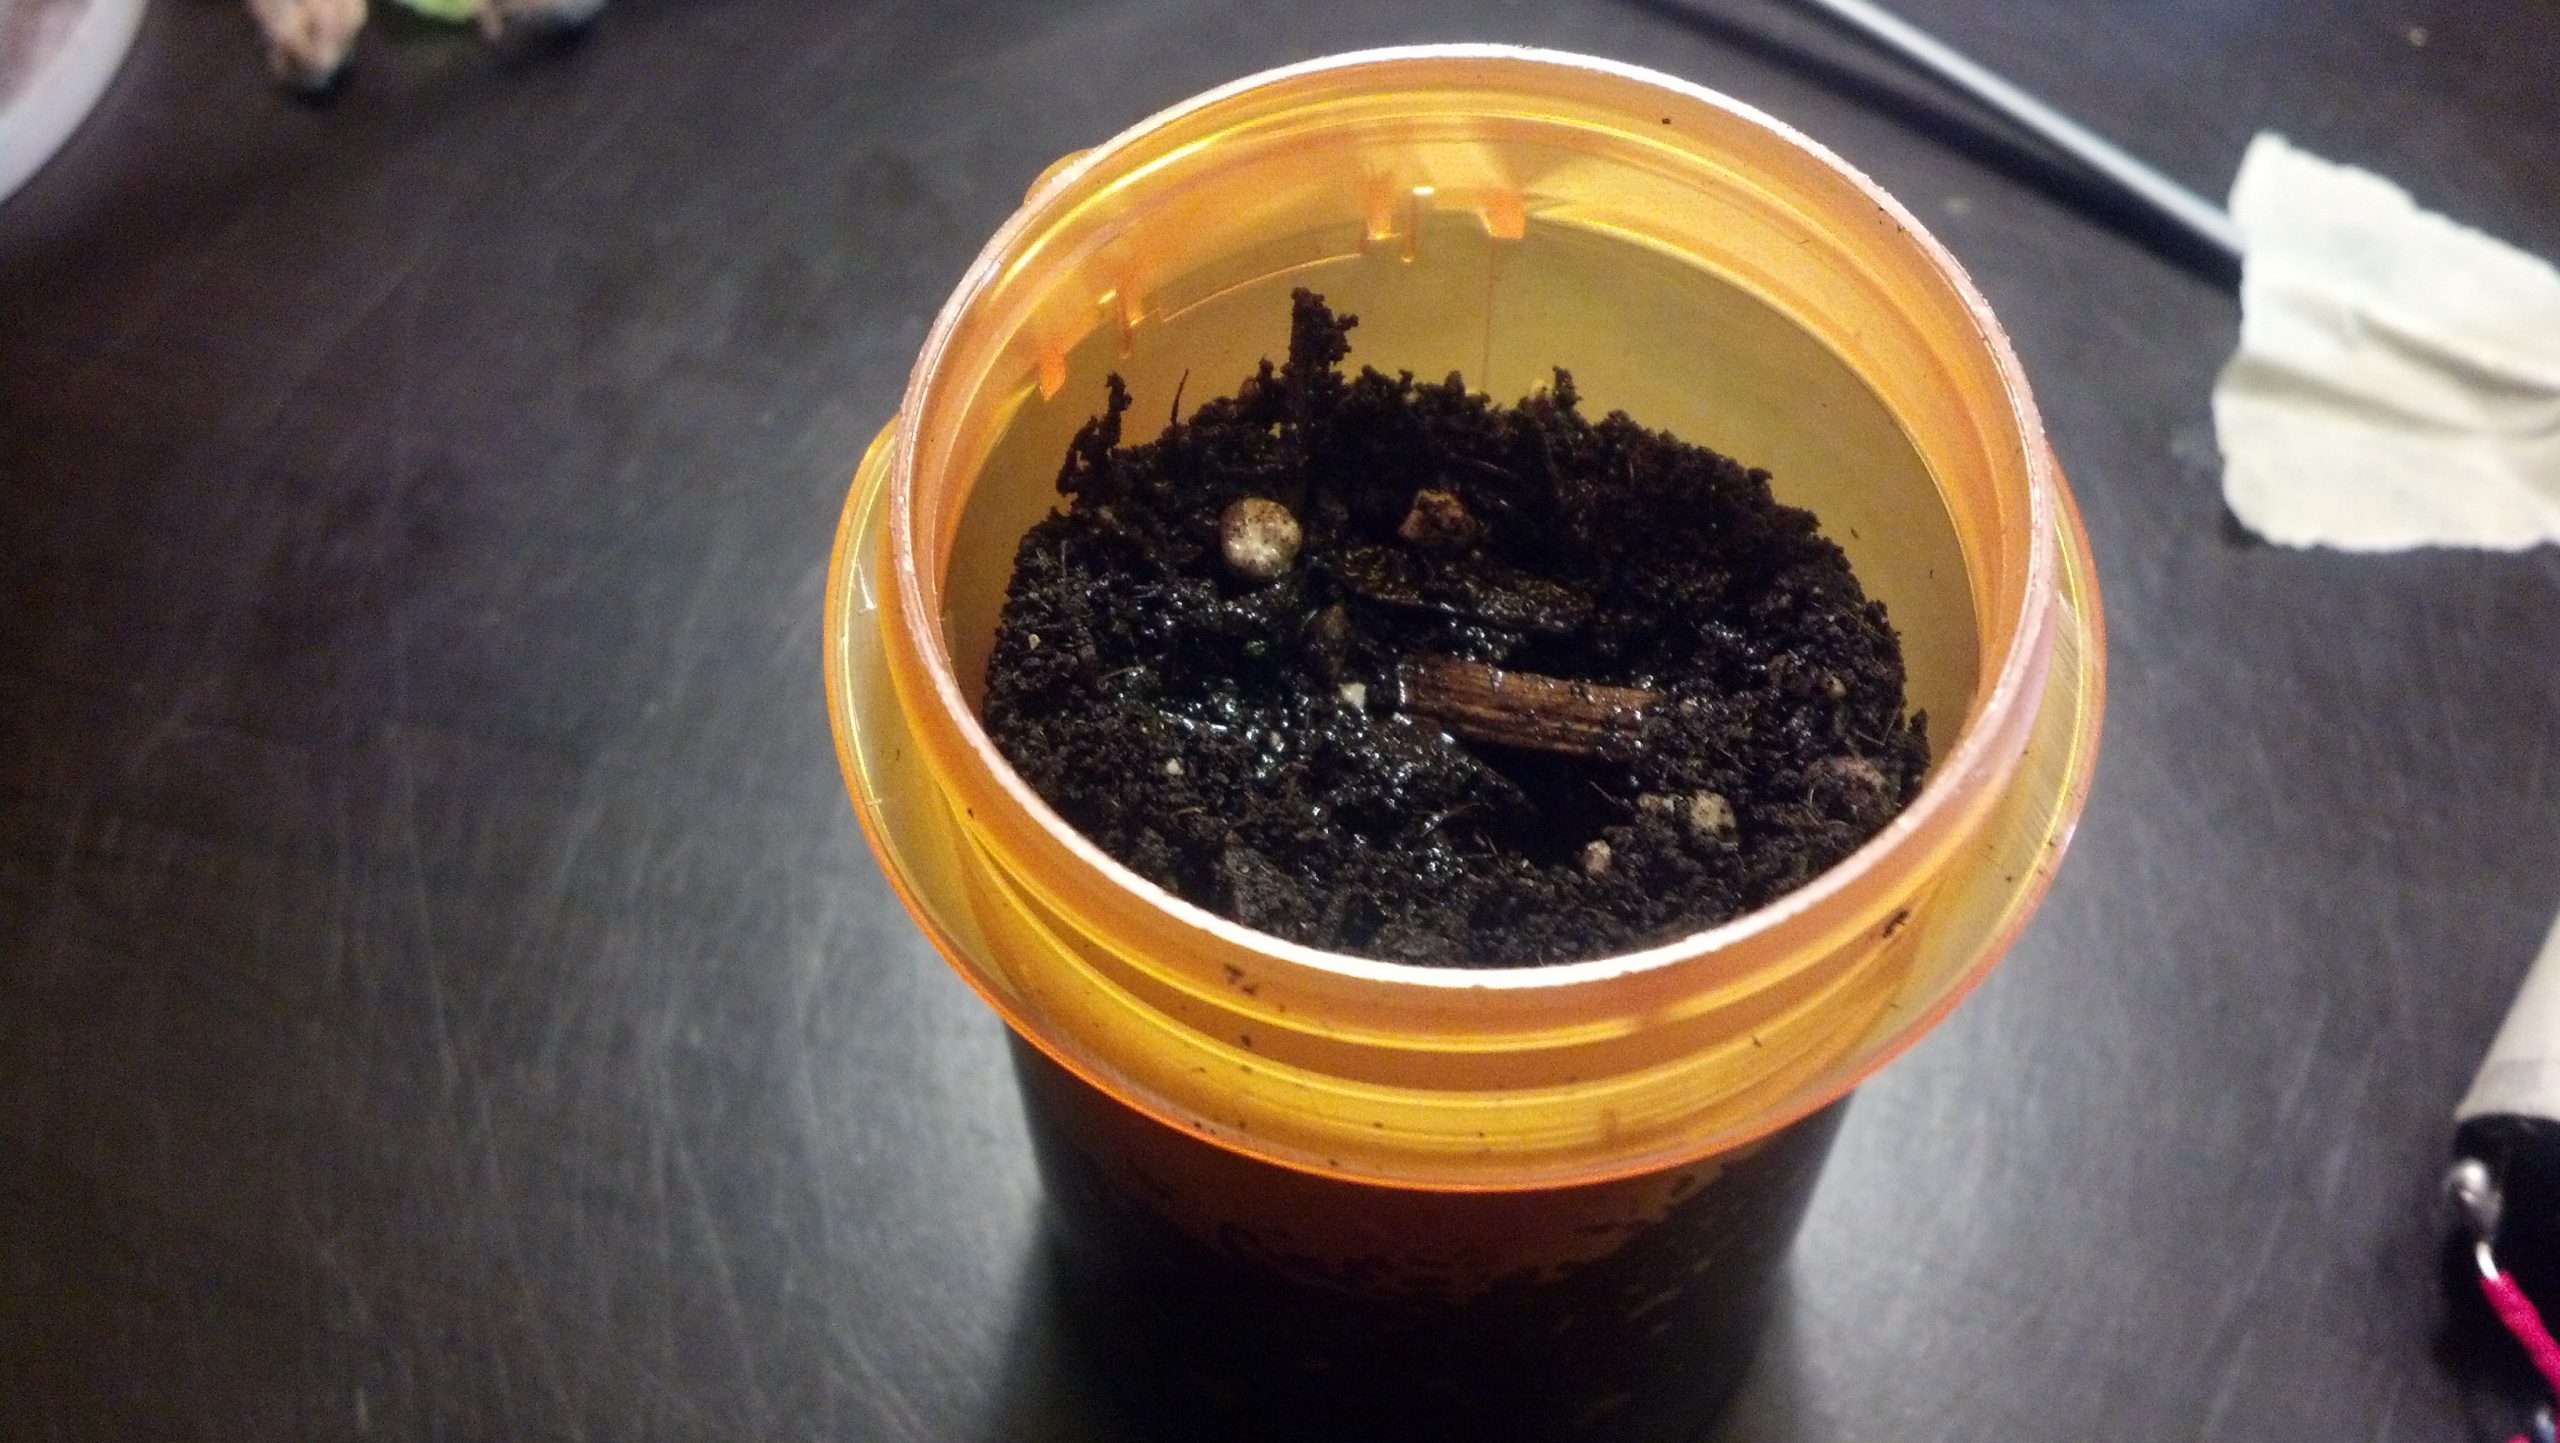
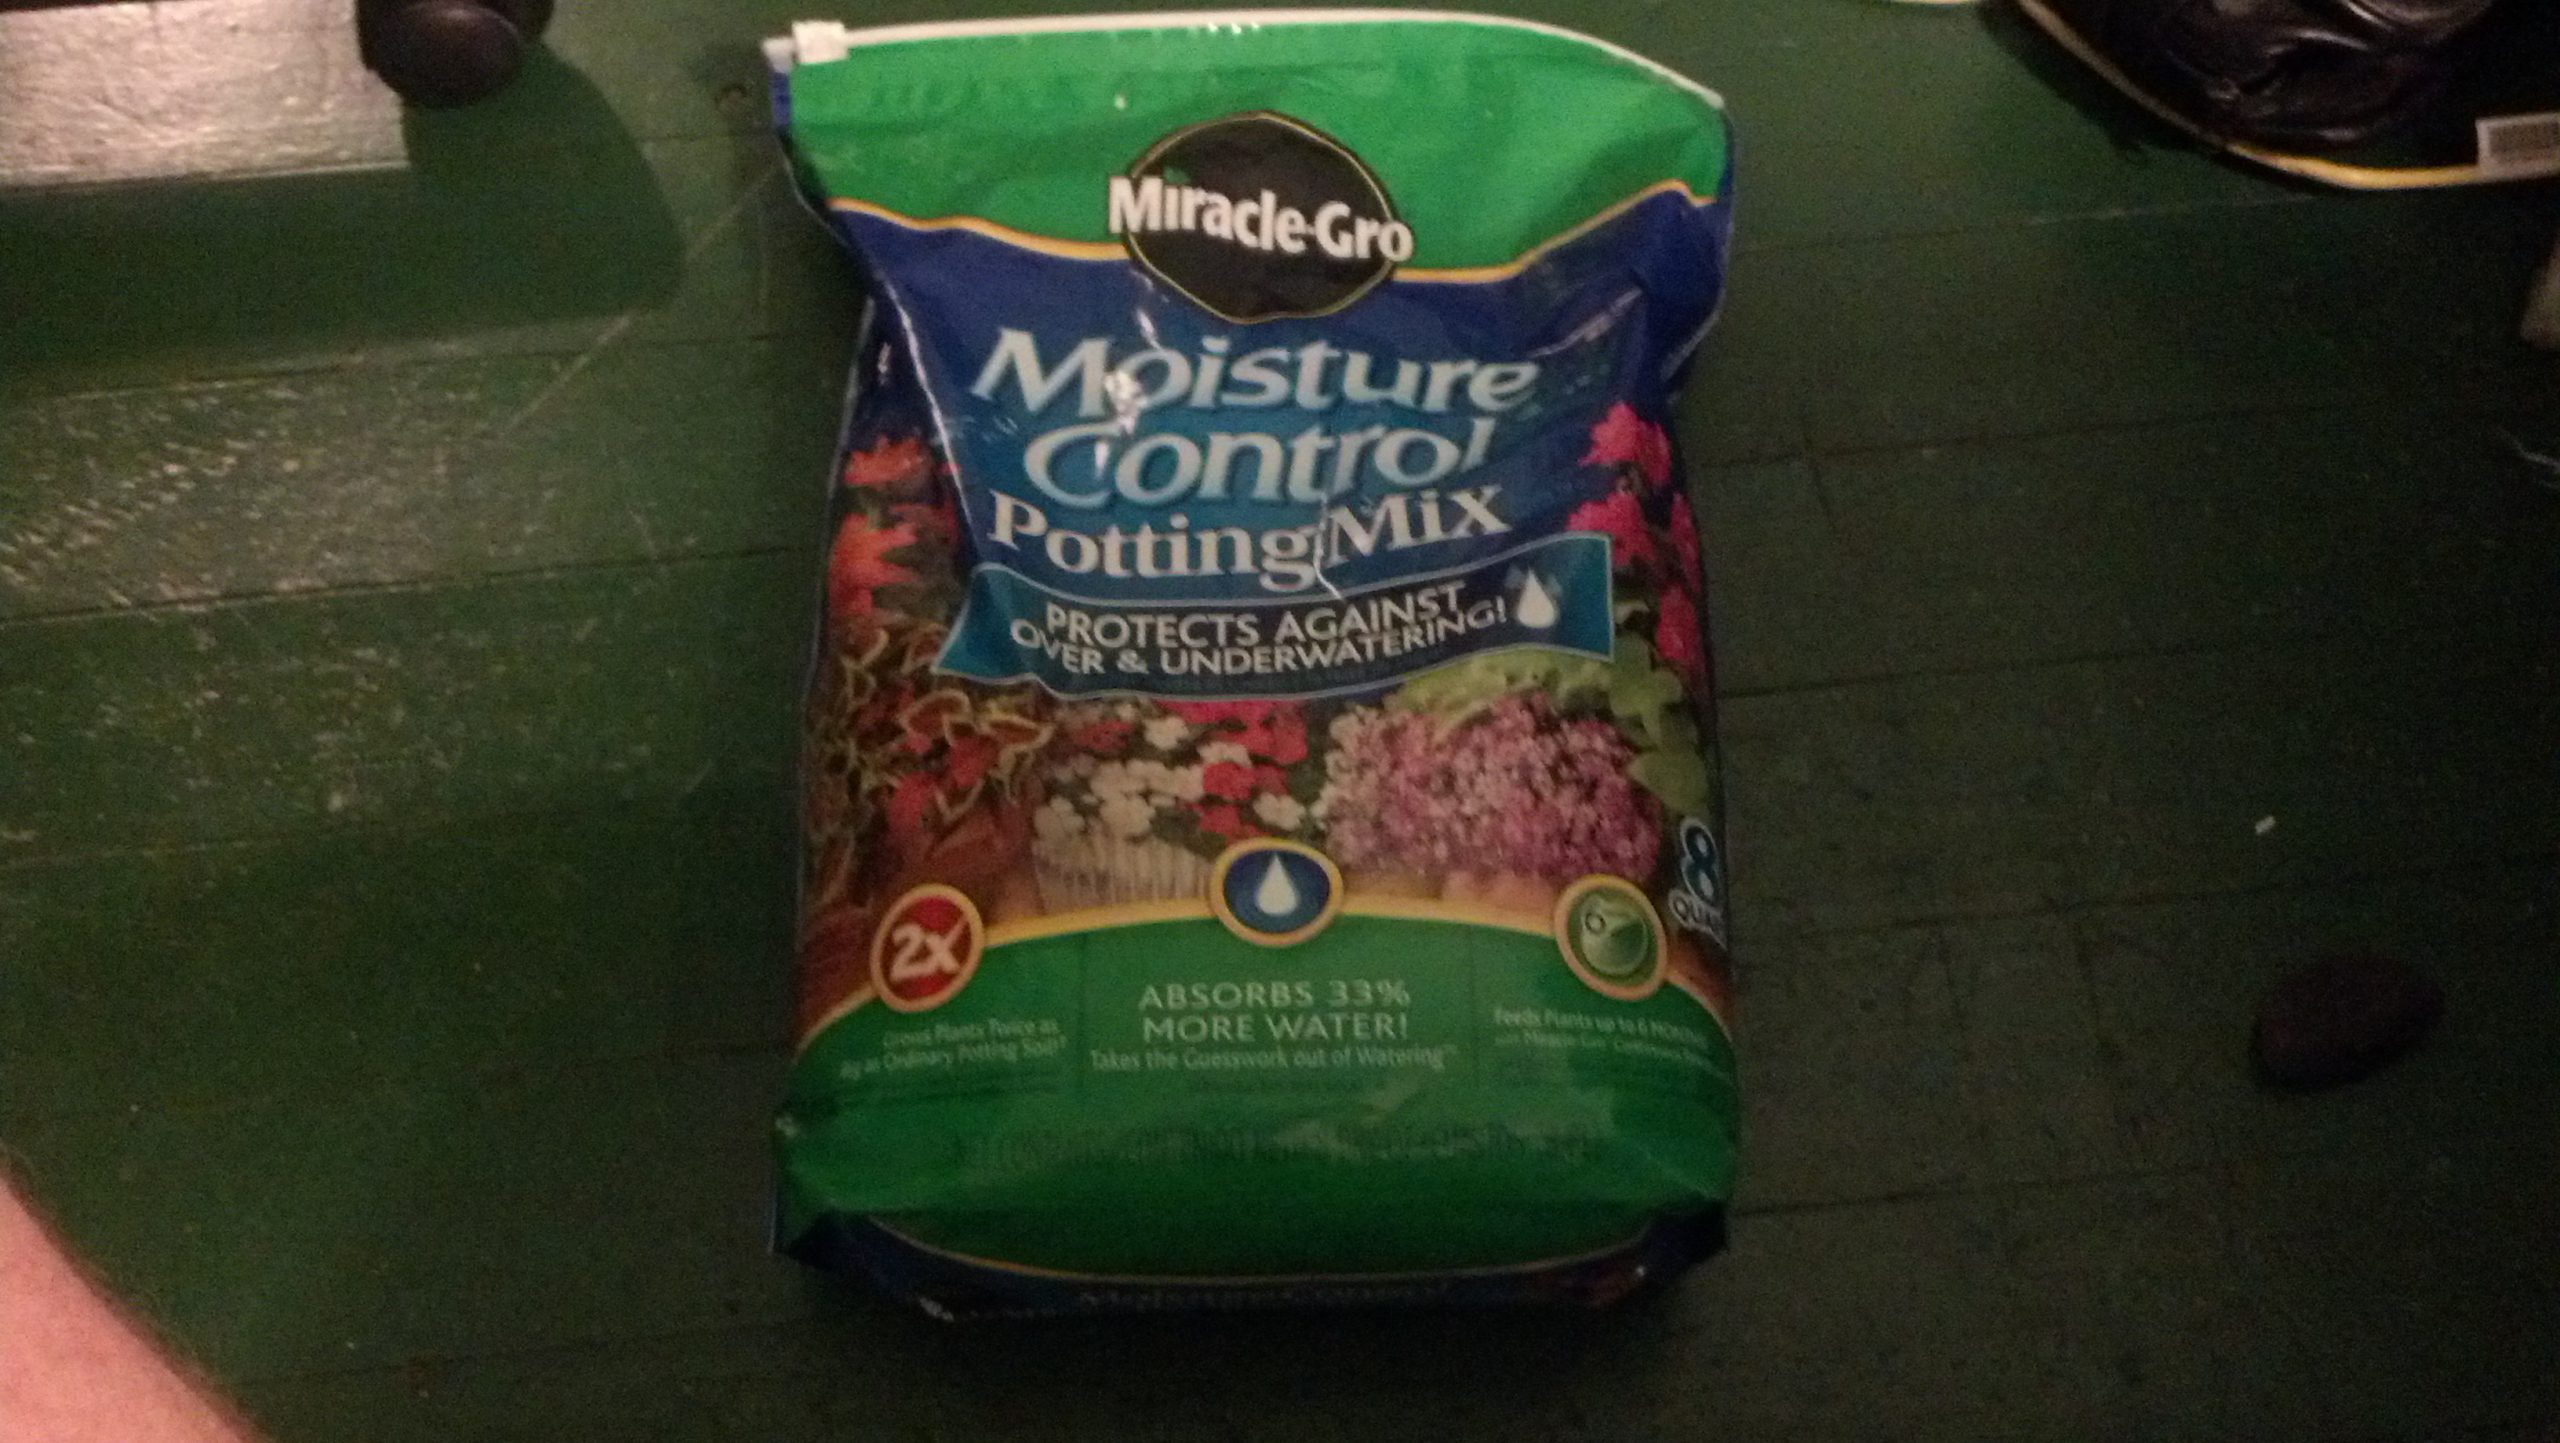
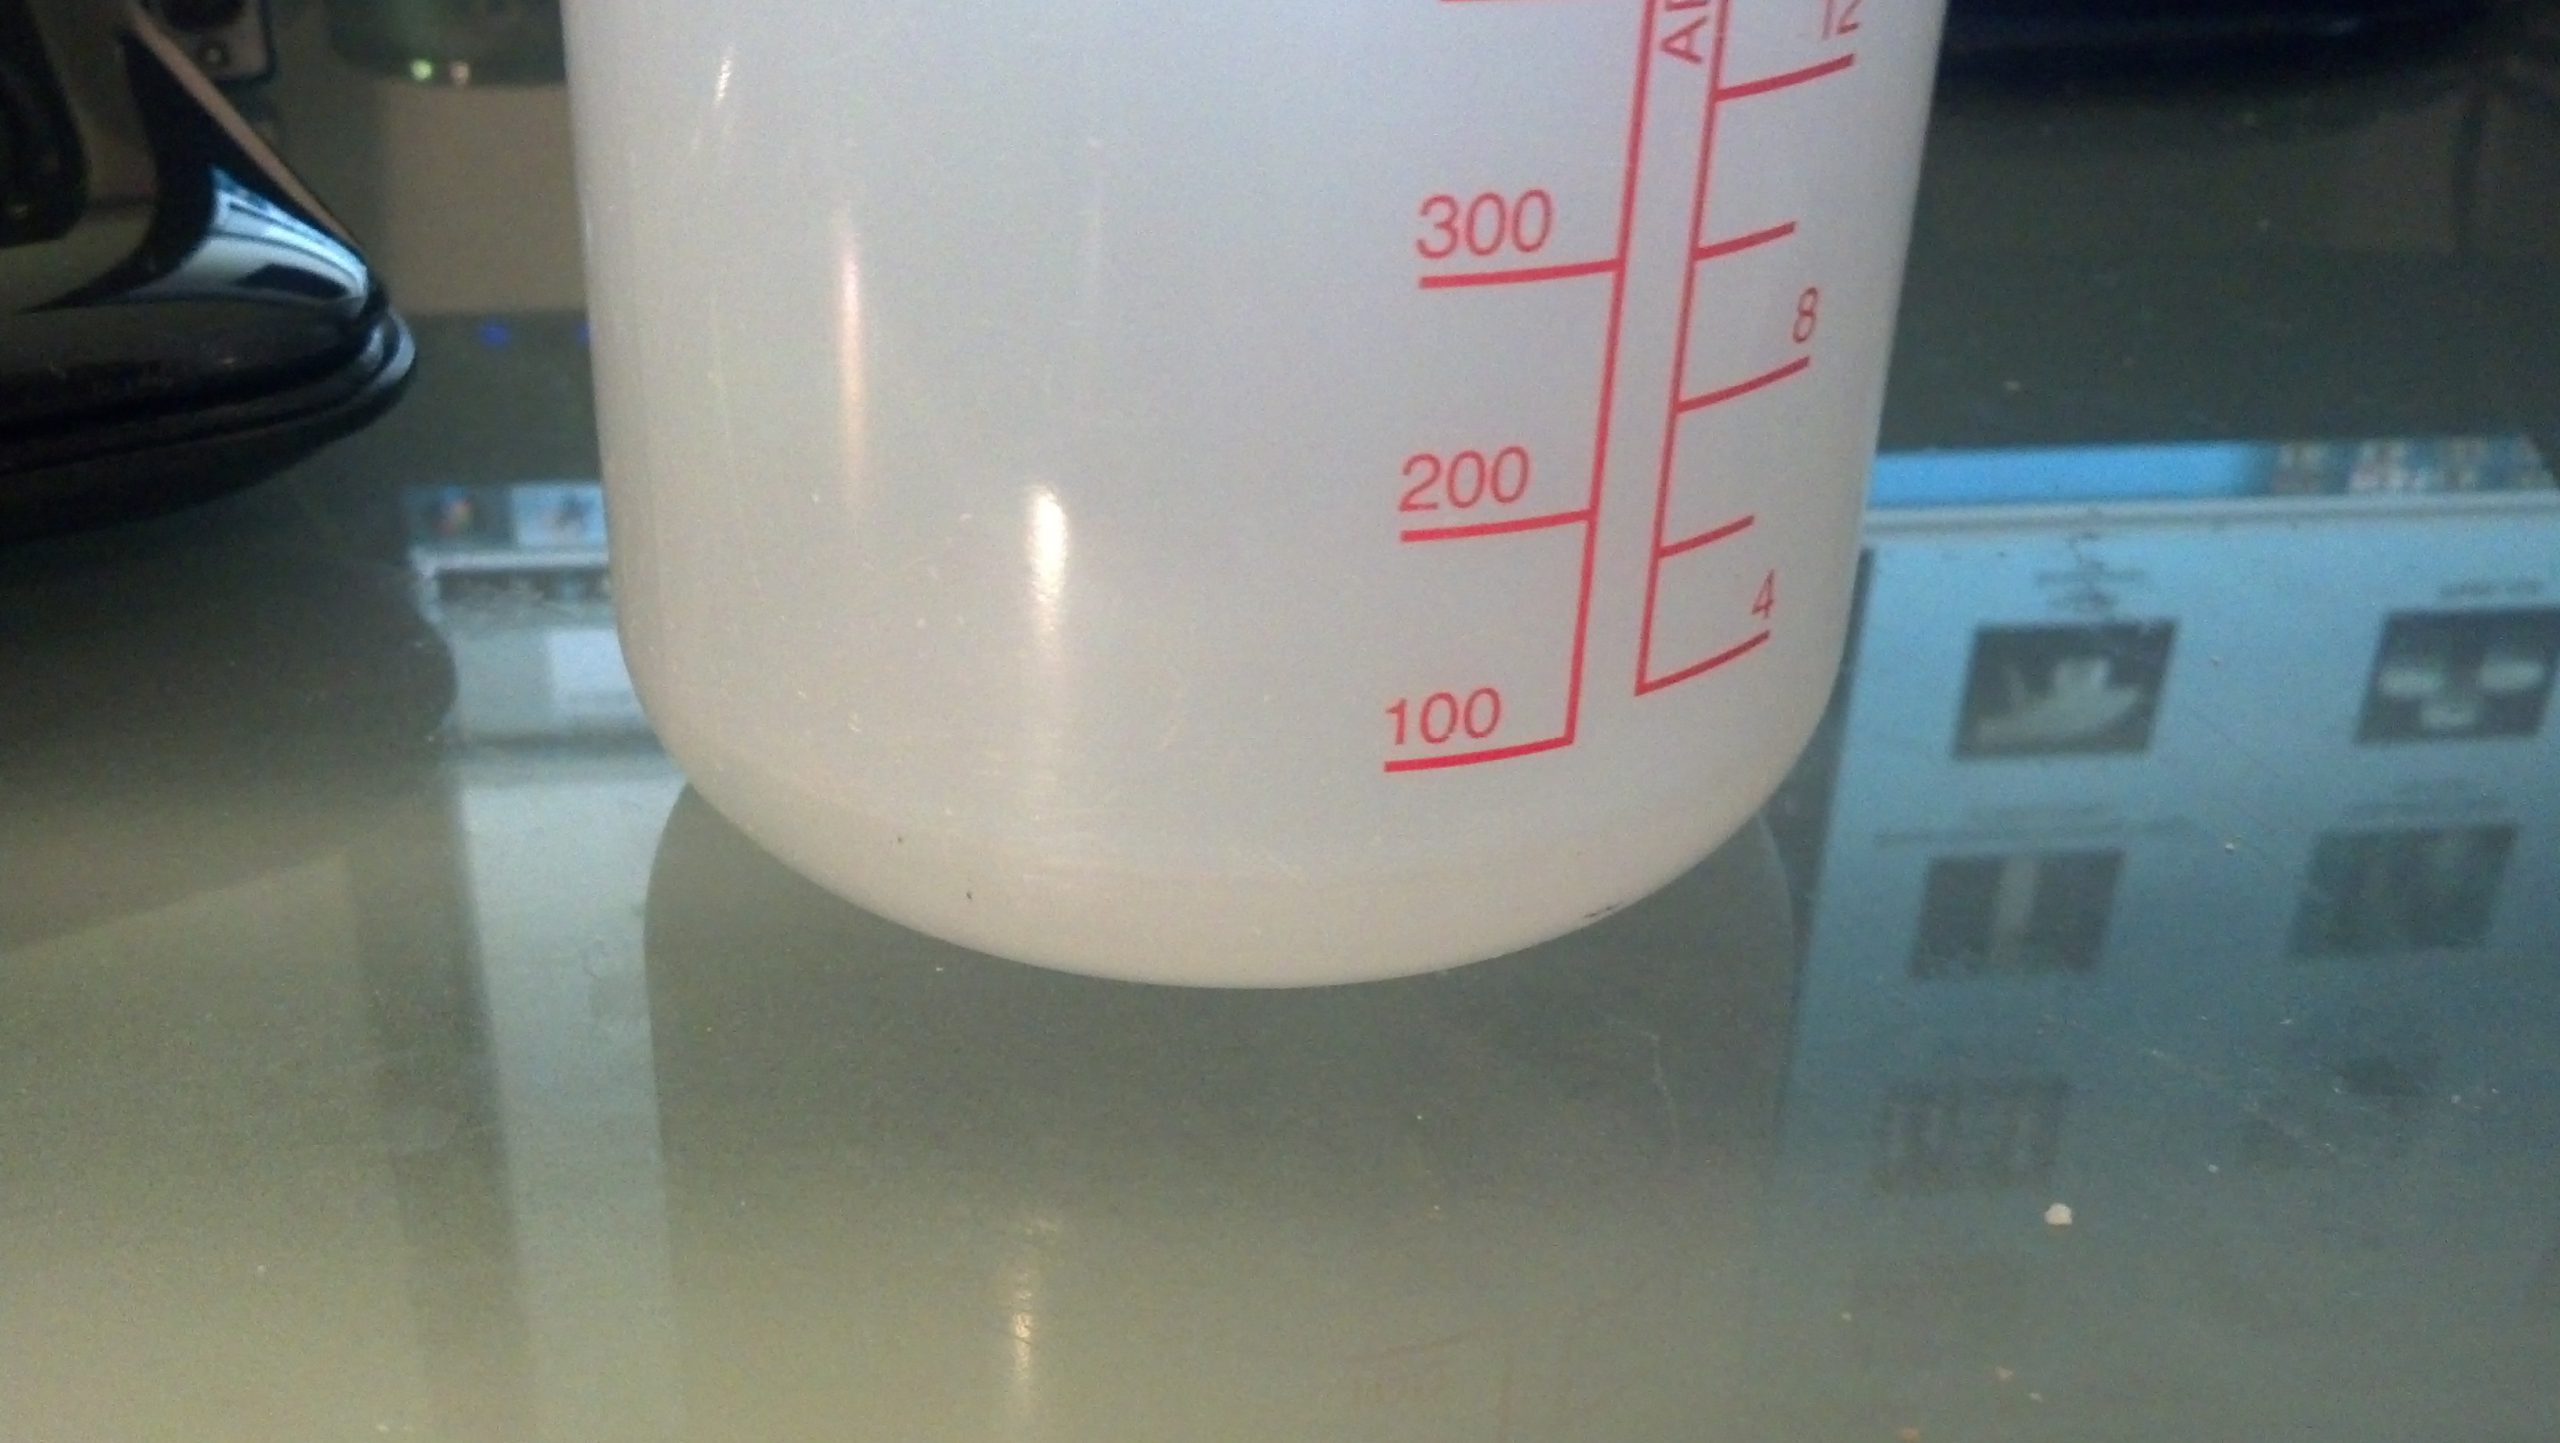
I used the same soil as seen in the previous post, and added 125mL of water to each sample.
Here’s a video of me explaining the whole process:
Once enough data is collected I’ll post a graph of it here.